Stocks and Bonds Waiting on Politics and Policies
Stock-Markets / Financial Markets 2010 Nov 02, 2010 - 05:07 AM GMTBy: Katherine_Nixon
 Risk assets continued to rally in October, carrying over the positive momentum from September. While historically cruel months for equities, this autumn proved to be an exceptional exception: The Standard & Poor's (S&P) 500 has advanced roughly 13% in the past two months. The S&P 500 rose 3.7% in October, its best October since 2003, and the Dow, Nasdaq and Russell indexes gained 3.1%, 5.9% and 4%, respectively. The international markets also participated in this "risk-on" trade and developed markets as well as emerging market indexes gained, with the MSCI EAFE up 3.6% and the MSCI EM rising 2.9%.
This will be a news-heavy week here in the United States, with the important mid-term elections tomorrow. The widely anticipated two-day Federal Open Market Committee meeting ends Wednesday, and its statement is expected to outline the next phase of planned monetary stimulus. The intensity with which we will view both is a perfect reflection of the general sense of anxiety felt around current conditions. Dissatisfaction with the stutter-step pace of economic recovery along with the seeming impotence of legislative initiatives have combined to ignite a powerful spark. Simply put, it is the "do something" movement.
One of our major themes - "battle of the micro vs. the macro" - was well reflected in many of the data points we received last week and throughout the month. On the "micro" side, corporate earnings generally beat Wall Street analyst expectations, with close to 80% of firms in the S&P 500 that have reported results besting estimates, and continued cost-cutting and corporate austerity measures have resulted in solid bottom-line results. On the "macro" side, however, we continue to see strains in the broader economy on a number of important fronts: employment, housing and broad activity measures. Conditions remain fragile in developed Europe as well, with economic data skewing weak.
In the United States, the economic report card was delivered Friday in the form of the third-quarter advance estimate of gross domestic product (GDP) report. The U.S. economy grew a positive but uncomfortably low 2.0% for the third quarter, according to the Bureau of Economic Analysis, better than the tepid 1.7% pace of the second quarter, but the pace is slow enough to support fears of an economic stall. The report itself was a bit of a mixed bag, with relatively robust figures for real personal consumption, which grew 2.6% despite the continued high level of unemployment. This growth in spending was in excess of income growth during the same period, which was captured in another data point we received this morning on the national savings rate: the savings rate has continued to fall from the 6.0% level of May 2010 to 5.3% in September.
Imports grew at a whopping 17.4% annualized pace, while exports grew only 5% and took a full two percentage points off of GDP. Key to the report coming in around the 2.0% consensus rate was the strength in inventory build. The $115.5 billion rise in inventories was the largest increase since the first quarter of 1998 and contributed 1.4% to the headline GDP number - two-thirds of the growth in GDP! Real final sales, in contrast, rose a fragile 0.6%. Final sales have decelerated consistently since the fourth quarter 2009. Once again, this is unsustainable and the gap between inventory building and final demand must shrink. This can happen in one of two ways: an increase in final demand, or a decrease in inventory build. If the Fed gets its way, it will be the former.
The weakness in overall data recently has served to ratify the Fed's contention that further stimulus is needed in order to prevent the economy from decelerating further and, in fact, to encourage investment and spending. The next round of quantitative easing, or "QE2," has most certainly been the focus on investor attention since Fed Chairman Ben Bernanke announced this intention in August. It has propelled returns in risky assets as investors expect a bold program of Treasury buying will continue to push down yields across the curve. Estimates for the size of the program have ranged from $500 billion to $2.0 trillion, with consensus that the initial QE2 program will involve the Fed buying $500 billion of Treasuries in a measured way over time. Certainly not the "shock-and-awe" strategy undertaken in March 2009 when the Fed embarked on a $1.75 trillion program of buying government debt and mortgage securities in response to the global financial crisis, but a more moderate approach should enable the Fed to build in some much needed flexibility into the next phase of this important program. We will hear on Wednesday more detail, as Bernanke has vowed to operate with more transparency and better contemporaneous communication than past Fed chairs.
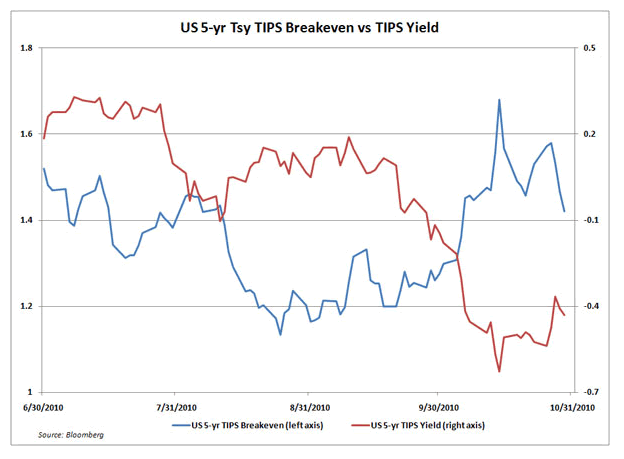
In classic "buy-on-the-rumor and sell-on-the-news" style, Treasuries had a performance hiccup last week as yields on the benchmark 10-year rose above 2.70% for the first time since August, much off the low reached earlier in October of 2.38%. As we get closer to the Fed announcement, many fear that the program may not be big enough or bold enough. In addition, there are growing fears that the program will end in an inflationary environment which, although this is an intended outcome - Bernanke has stated clearly that inflation is uncomfortably low at this time - will debase real asset values in the future. Potential longer term inflationary consequences of this program are well-reflected in the 30-year bond yield rising to top the key 4% level for the first time since August. Market expectations around inflation have shifted and are reflected in the chart below that looks at the inflation rate embedded in Treasury Inflation Protected Securities (TIPS) yields. You will note that not only have inflation expectations risen, but also the yield on these securities has crossed over the zero boundary to the negative. For the first time, the 5-year TIP was issued (at the re-opening of an auction of bonds) with a negative yield of -0.55%. This is proof-positive that the Fed has succeeded in changing market expectations.

Well-respected market experts like Bill Gross have reflected on Fed policy as a Ponzi scheme and famed investor Jeremy Grantham has continued to bemoan past and present destructive Fed policies under Greenspan and Bernanke as deliberately creating asset bubbles while being ineffective in increasing long-term sustainable growth. Thus, it is no wonder the market is taking quite seriously the intended and unintended consequences of the new round of stimulus. These commentaries are accessible through the PIMCO and the GMO Web sites, and both are well worth reading.
Whatever the size of the QE2 stimulus, there is the possibility that any real effect will be fleeting and that the continued debt hangover will likely render the economy unresponsive to lower rates - a classic liquidity trap. As Bernanke himself stated in Jackson Hole this summer, central banks can't do it alone. Partnering with focused fiscal policy and a supportive legislative agenda will be a key to success here; however, collaboration may not be in the cards as we face a particularly contentious mid-term election season.
For the third time in a row, voters are set to oust a record number of longstanding House members. Republicans are expected to win a majority in the House tomorrow and to take several important Senate seats as well, leaving a divided D.C. and a House majority without a clear mandate. With a packed legislative agenda, including the crucial decision on the extension of the Bush tax cuts, gridlock is not an option during the potential lame-duck session. Despite the fact that a strong message may be sent tomorrow, it is not safe to assume that this will lead to policy action, and this could prove to be a disappointment to markets that expect change.
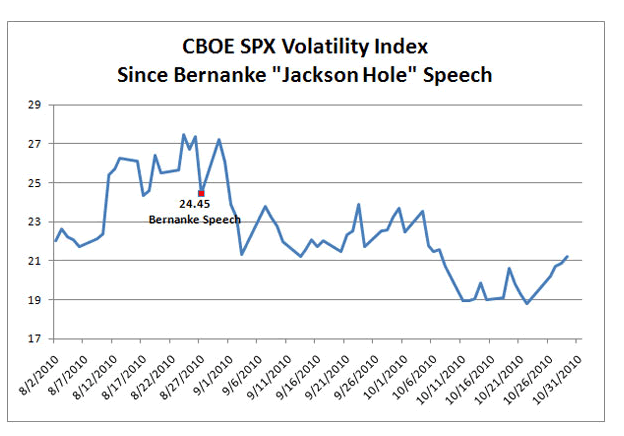
It is interesting to see that market optimism has grown around both Fed policy action and D.C. disruption, as stocks have rallied broadly; however, in contrast to climbing a wall of worry, this rally has resulted in apparent investor complacency. We can look at equity market volatility as a measure of the investor's state of mind, and the following chart reflects well the persistent reduction in market volatility post-Bernanke's forecasting QE2.

There are, of course, several potential wake-up calls for investors: success/failure of QE2 in meeting market expectations; resurgence in peripheral European Union debt problems; continued political tensions around currency policies; and, most recently, renewed focus on global terrorism with the news late last week that packages sent from Yemen contained explosive material.
We continue to maintain cautious optimism around risky assets in light of supportive central bank policies and healthy corporate fundamentals. The potential currency volatility that could be a by-product of the policies in place continues to support our gold exposure, even at this elevated price level. Finally, we remain tactically underweighted to fixed income based on our contention that the current rate environment does not offer compelling returns for investors.
Katherine Nixon,
Chief Investment Officer, Northeast Region
http://www.northerntrust.com
Katherine Ellis Nixon holds designations as a Chartered Financial Analyst and Certified Investment Management Analyst.
The opinions expressed herein are those of the author and do not necessarily represent the views of The Northern Trust Company. The Northern Trust Company does not warrant the accuracy or completeness of information contained herein, such information is subject to change and is not intended to influence your investment decisions.
© 2005-2022 http://www.MarketOracle.co.uk - The Market Oracle is a FREE Daily Financial Markets Analysis & Forecasting online publication.


