U.S. Treasury Bond Bubble about to POP!
Interest-Rates / US Bonds Oct 27, 2010 - 09:21 AM GMTBy: Claus_Vogt
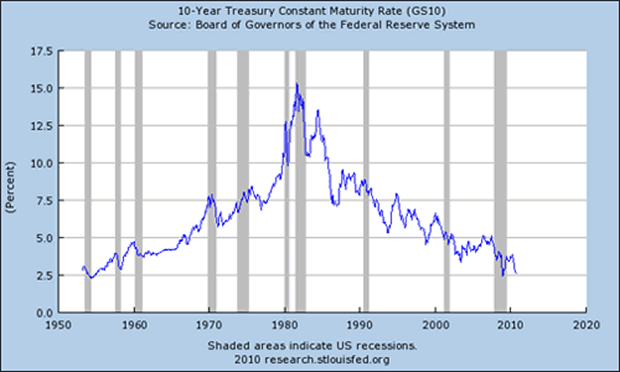
 Financial history shows that interest rates — and hence bond prices — have risen and fallen in long-term trends spanning decades. The following chart shows the 10-year Treasury since 1953.
As you can see, rates started rising shortly after the recession that ended in May 1954. In the second half of the 1960s this uptrend gathered speed. The market seemed to smell high inflation coming in the 1970s. And by the end of that decade and into 1980/81 rates soared. In fact, they peaked at slightly more than 15 percent — six times higher than the 1954 low!
|
Paul Volcker became chairman of the Federal Reserve in 1979. His agenda was to break the inflation cycle, no matter what. So he curbed the money supply growth by letting interest rates rise as high as necessary to achieve that goal.
Secular Downtrend Since 1981
Volcker succeeded. And by 1981 the secular downtrend in interest rates began.
Most market participants did not believe in the durability of Volcker’s victory over inflation. They didn’t realize the importance of the rate’s high in 1981 and bond market’s low.
Soon after the severe recession of 1981/82, rates started rising — even though inflation had dropped. They hit an important secondary high in mid-1984 only to start falling again … but in earnest.
Here we are in 2010, 29 years after the spectacular high rate of 1981. And yields for many short- to medium-term Treasuries — up to five years — have just reached new lows for this secular trend.
Indeed, 29 years is a long time, even for secular interest rate trends. So I’ve been looking for signs of an impending trend change, which could easily turn out to be of major importance.
However, markets often continue their long-term trends in spite of major changes in fundamentals …
They tend to continue — habitually if you will — even though the original fundamental forces driving the trend for a long time have silently faded and made room for opposite forces.
My impression is that the bond markets have finally reached that point …
We have skyrocketing government deficits throughout the world and outspoken inflationary goals. At the same time, Ben Bernanke’s Fed and his international brethren seem to ignore the longer-term implications of currency debasement that their fiscal and monetary policies are leading to.
And I see …
Three Subtle Signs of an Impending Trend Change
First, is the huge money inflow that has bond mutual fund managers so excited. Bond fund monthly inflows are rivaling those of stock mutual funds during their record year of 2000. Unfortunately financial history is telling us that whenever a market is being discovered by the masses it’s in the final stages of a secular bull market.
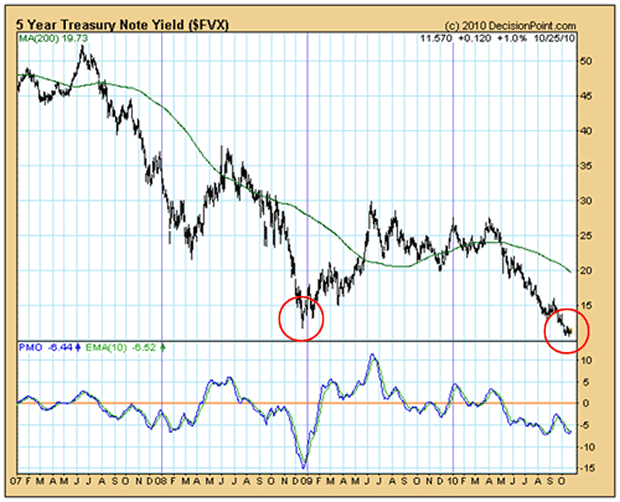
Second, the chart pattern for Treasury yields may very well turn out to be a major bottom formation — a huge double-bottom. The first was a panic low associated with the banking crisis of 2008. The second low is currently in the process of being formed.
Speculating on a new round of what the Fed has named “quantitative easing,” that is buying Treasury bonds with newly created money, seems to be behind the strong down move in yields during the past months.
This move looks like front running of the Fed. “Buy the rumor sell the fact” may well be the credo of many astute buyers …
Knowing that another buyer with very deep pockets and no loss aversion is coming in later, recent buyers have driven prices up, determined to dump their holdings to market participants like the Bernankes of the world.
Therefore, I believe there is a real possibility the planned effects of QE2 have already taken place in anticipation of the Fed’s next policy step. And the monetary bureaucrats may be in for a nasty surprise.
Third, there are obvious divergences in the behavior of different maturities. Up to five-year yields have declined below the December 2008 low, as shown in the following chart …
|
Source:www.decisionpoint.com
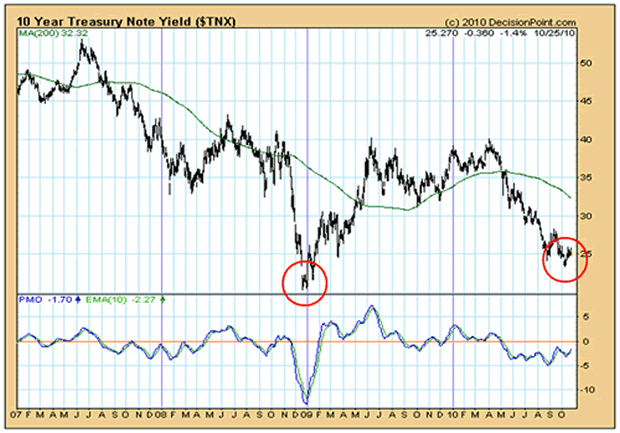
But longer maturities haven’t! Just look at 10-year yields in the chart below …
|
Source:www.decisionpoint.com
This lack of uniformity is a typical characteristic of the latter stages of long-term trends. And I interpret it as an important signal that the secular bond bull market is about to end.
When it does, rising interest rates — probably relentlessly rising — will be with us for a very long time to come.
Best wishes,
Claus
This investment news is brought to you by Money and Markets. Money and Markets is a free daily investment newsletter from Martin D. Weiss and Weiss Research analysts offering the latest investing news and financial insights for the stock market, including tips and advice on investing in gold, energy and oil. Dr. Weiss is a leader in the fields of investing, interest rates, financial safety and economic forecasting. To view archives or subscribe, visit http://www.moneyandmarkets.com.
© 2005-2022 http://www.MarketOracle.co.uk - The Market Oracle is a FREE Daily Financial Markets Analysis & Forecasting online publication.


