


Weekly Gold and Silver Technical Analysis Report - 7th Oct 07- Technically Precious with Merv
Commodities / Gold & Silver Oct 07, 2007 - 04:47 PM GMTBy: Merv_Burak

We had a little scare earlier in the week but it may be all over now -- or is it? Will world events control the fortunes of gold or will it be the US $? Push/pull, whatever.
URANIUM
Before getting into my weekly precious metals commentary I thought I'd bring to your attention a new blog that was launched this past week. Over the past year or two I have had many readers asking questions about uranium stocks. Many have suggested that I should include a uranium commentary with these commentaries. This led to the creation of a blog that is dedicated to discussing daily and weekly activities of uranium stocks.
The blog is located at http://techuranium.blogspot.com and I invite all to check it out. It is a purely technical blog (no fundamental information) so may not be for everyone but if you don't check it out you'll never know if it is for you or not. For those that like fundamentals I have provided links to some excellent sites. I'm new to this blogging game and the blog is still a work in progress so be kind.
GOLD : LONG TERM
There was nothing very spectacular happening from the long term perspective over the past week so I didn't thing a chart was necessary this week. However, looking at a chart of gold one is struck by the fact that, having moved into new bull market highs gold just seemed to get stuck. After a break into new highs one would expect explosive upside action. This has not occurred and is a concern for the validity of the upside break. As always, go with the trend in motion BUT keep this caution in mind and be prepared for a reversal. It is not an unknown practice for professionals to boost the price to create interest while they then get out under the radar screen of such activity.
For a quick rundown, Gold continues to trade above its positive moving average line with a momentum indicator that is inside its positive zone. On a daily chart this long term momentum has been trapped in a lateral “box” since June of last year with the support at the 50% level and resistance at the 57% level. We are at 56% on Friday. The long term remains BULLISH with the cautionary note previously indicated.
INTERMEDIATE TERM
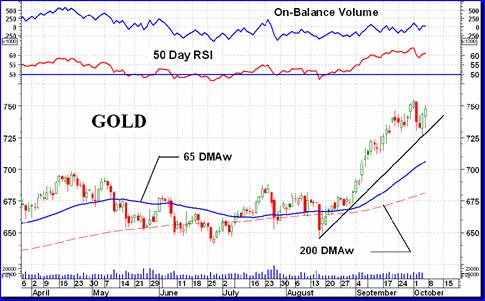
The reaction this past week seemed to have halted on top of the two month up trend line. So far, so good. The price activity has been all above the intermediate term positive moving average line. Momentum continues positive but there is a hint of a topping process, not serious yet but a hint. With both the price and momentum moving comfortably above their previous April highs all looks to be rosy. However, volume is a bummer. The volume indicator is nowhere near its April high and has taken a lateral motion, more near its low. The intermediate term can still be considered as BULLISH but with that volume action the longevity of this bullishness may be a concern. Stay with the trend but watch should the price break below the trend line.
SHORT TERM
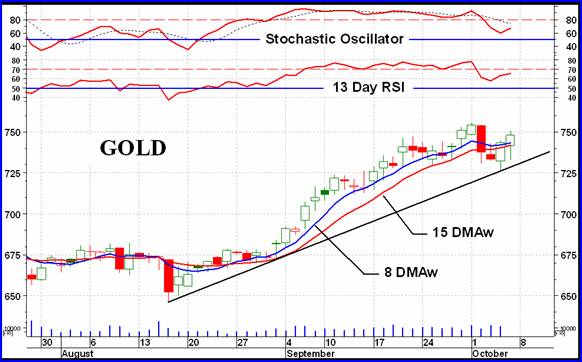
Both the short term momentum and moving average have remained positive so we are still technically in a short term bullish trend. However, the actions on Tuesday and Wednesday did take a lot out of the bullishness. With a well positioned up trend line so close I would normally wait for it to be broken before reversing direction. However, should the price move lower again in all likelihood the very short term moving average will cross below the short term average and this would give you the signal that the trend has changed. Consider it a trend change whichever of the two occur first. As far as the next couple of days are concerned, the immediate term direction is to the up side so consider it to continue.
North American Gold Indices
Looking over the five North American major Indices that I review in this section each week I see that none of them has REALLY broken into new highs, at least none with any gusto. They just seem to be sitting there at the high waiting for something to give them that extra kick. I am always cautious when a stock or Index breaks into new highs but doesn't go anywhere. A move into new highs, when representing enthusiasm, should explode on the up side or at least make a good run for a few days leaving the previous high some distance below. This is not happening with the major Indices or with gold itself. Until these Indices give more evidence that they do in fact want to continue moving higher one must step back and watch and wait.
The Index shown this week is the Dow Jones Precious Metals Index. What I've been talking about here can be easily seen on this chart. The Index broke through into new highs but hasn't gone anywhere.
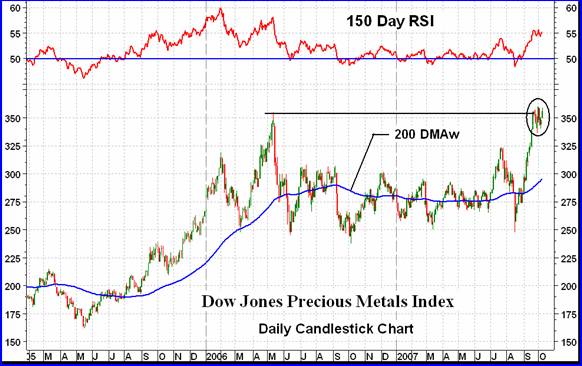
One explanation could be that the Index had a good swift run-up to this point and needs to take a rest before continuing. That sounds good and we'll keep it in mind but also be prepared for some down side action.
MERV'S PRECIOUS METALS INDICES
It's been a so-so week for the various Merv's Indices. The Composite Index of Precious Metals Indices closed almost neutral on the week (actually up by 0.002%). As the Index continues near its all time high the long term momentum continues to show weakness and has not yet confirmed the recent Index high. A battle seems to be raging, bull or bear which will it be?
MERV'S GOLD & SILVER 160 INDEX
The average weekly performance of the 160 stocks in the universe was a paltry 0.1% on the up side. Not worth opening up the Champagne . This neutral week is further shown by the number of advancing and declining stocks. They were almost 50/50. There were 74 advancing stocks (46%) and 78 declining stocks (49%). In keeping with a neutral or quiet market there were no stocks that made it into the 30% weekly move category, showing extreme speculation to be no where in sight. It's difficult to say if we are in a topping phase or if the stocks are just taking a rest after a few weeks of upside action. Time will tell.
Unlike the majors this Index moved into new high territory earlier in the year. The July/Aug decline was hard on the Index and it has not yet recovered from it. It is nowhere near its previous highs and is showing weakness. However, having said that, the rally from the Aug low has been quite good as far as it goes. The trends have turned around and the Index is above both its intermediate and long term moving average lines and both lines are heading higher. Momentum in both cases is positive and pointing higher. From this I can only remain BULLISH on both the long and intermediate term.
MERV'S QUAL-GOLD INDEX : MERV'S SPEC-GOLD INDEX : MERV'S GAMB-GOLD INDEX
This is probably the only place you will find gold Indices that show what the different quality of stocks are doing, i.e. the high quality, the second tier and the gambling variety. From this you get a better idea if you should be thinking investing or gambling or just staying out.
All three Indices closed higher on the week but with gains of 0.4% to 1.7% it was no big deal. The Qual-Gold Index has just inched into new all time highs while the Spec-Gold and Gamb-Gold are still some distance from their previous highs. The Qual-Gold Index is acting very much like the majors, reaching new highs while the more speculative stocks are not moving as one would hope. The recent rally was primarily a “quality” rally. When quality moves but not the speculatives that is an indication of a market that is not yet sure of its footing. It's when the speculative stocks take hold you then know that the primary sentiment is to the up side.
Looking at the charts of these three Indices one gets a similar picture with each. All are tracking above their intermediate and long term moving average lines and all of the lines are pointing upward. Intermediate and long term momentum indicators for all three Indices are in their positive zones and heading higher. For now I can only be BULLISH on the long and intermediate term for all three Indices.
SILVER
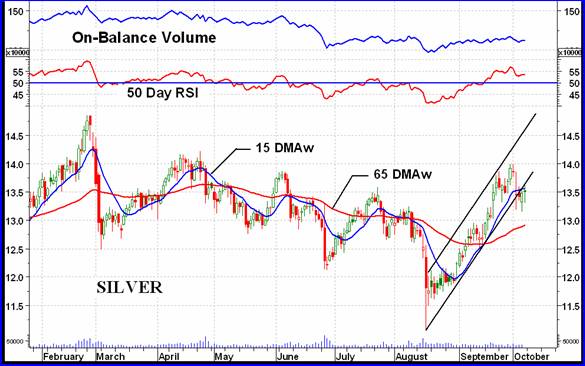
For some time now silver has been the weak member of the precious metals family, even if you put in Palladium and Platinum into the picture. With a loss of 3.0% on the week silver far out did gold, which had only a 0.4% loss. More importantly, one can see the volume indicator showing weakness as the price rose. The flat On-Balance Volume suggested that there were just as many traders during the down days as during the up days. Not a sign of bullishness. We are still far away from new high territory here. Even the high of last Feb has not yet been breached. For now silver is not the place to be looking for terrific gains.
MERV'S QUAL-SILVER INDEX : MERV'S SPEC-SILVER INDEX
Despite the down week for silver, the Spec-Silver Index had a plus week. The Qual-Silver had a down week. Neither were of much consequence. Except for the long term Spec-Index moving average, all of the other indicators are in their positive readings, similar to the gold Indices. The long term Spec-Silver moving average is still pointing lower and the Index itself is below the moving average line. I am BULLISH on the long and intermediate term Qual-Silver Index and the intermediate term Spec-Silver Index. The long term Spec-Silver rating can best be rated as – NEUTRAL, one level above a full bear due to the positive momentum.
Merv's Precious Metals Indices Table
That's it for another week. Again, I invite all to take a look at the new uranium blog at http://techuranium.blogspot.com .
By Merv Burak, CMT
Hudson Aero/Systems Inc.
Technical Information Group
for Merv's Precious Metals Central
Web: www.themarkettraders.com
e-mail: merv@themarkettraders.com
During the day Merv practices his engineering profession as a Consulting Aerospace Engineer. Once the sun goes down and night descends upon the earth Merv dons his other hat as a Chartered Market Technician ( CMT ) and tries to decipher what's going on in the securities markets. As an underground surveyor in the gold mines of Canada 's Northwest Territories in his youth, Merv has a soft spot for the gold industry and has developed several Gold Indices reflecting different aspects of the industry. As a basically lazy individual Merv's driving focus is to KEEP IT SIMPLE .
To find out more about Merv's various Gold Indices and component stocks, please visit www.themarkettraders.com and click on Merv's Precious Metals Central . There you will find samples of the Indices and their component stocks plus other publications of interest to gold investors. While at the themarkettraders.com web site please take the time to check out the Energy Central site and the various Merv's Energy Tables for the most comprehensive survey of energy stocks on the internet. Before you invest, Always check your market timing with a Qualified Professional Market Technician
Merv Burak Archive |
© 2005-2022 http://www.MarketOracle.co.uk - The Market Oracle is a FREE Daily Financial Markets Analysis & Forecasting online publication.