UK Public Sector Spending Cuts Impact on Deficit, Debt, Unemployment and Economy
Economics / UK Economy Oct 22, 2010 - 08:39 AM GMTBy: Nadeem_Walayat
 The Coalition Government on Tuesday (21st Oct) translated it's proposed spending cuts total of £81 billion over the next 4 years into a break down of which public sector departments will bare the weight of the cuts, whilst at the same time trying to persuade the population that the austerity measures have been spread across all income groups.
Key Points:
- Average 19% cut per government department over 4 years.
- 500,000 job losses
- Aim to eliminate structural deficit (£81 billion) by 2015.
- Additional benefit cuts of £7bn on top of £11bn already announced (mostly child benefit cuts).
- NHS and Education protected
The aim of the public sector spending cuts is to shrink the size of the public sector that under Labour had mushroomed to more than 50% of the economy and acted like a noose around the economies neck the manifestation of which was in the huge and unsustainable budget deficit of £155 billion or more than 10% of the annual GDP.
Spending Cuts Important Factors
Their are two important factors to take into account when considering the headline grabbing statements of departmental cuts of upto 30%.
a. That the cuts will be phased in over 4 years.
b. That inflation of approx 3% per year has to be considered.
This means that allowing for the impact of inflation AND phasing in means that actual spending cuts will be far less in both nominal and percentage terms because inflation annually will lift the spending budgets that are being subject to phased nominal cuts. For example a £100 billion budget in on year would rise to £103 billion after inflation, therefore a £10 billion cut over 4 years would itself be indexed for inflation which it would not be if all of the the cuts took place in the first year. I.e. in the example £10 billion of cuts in the first year would result in a year 4 budget of £101.7bn, whereas phased in cuts of £10 billion would result in a budget total of £102.2bn as a consequence of inflation. Therefore as per the example, the total actual cuts over 4 years would be £23 billion against £40 billion if all if the £10 billion was immediately cut.
UK Public Sector Spending Projection to 2014-15
The following graph translates the announced cuts into spending department budget totals as phased in over the next 4 years (2014-15) after being indexed for inflation at 3% per year.
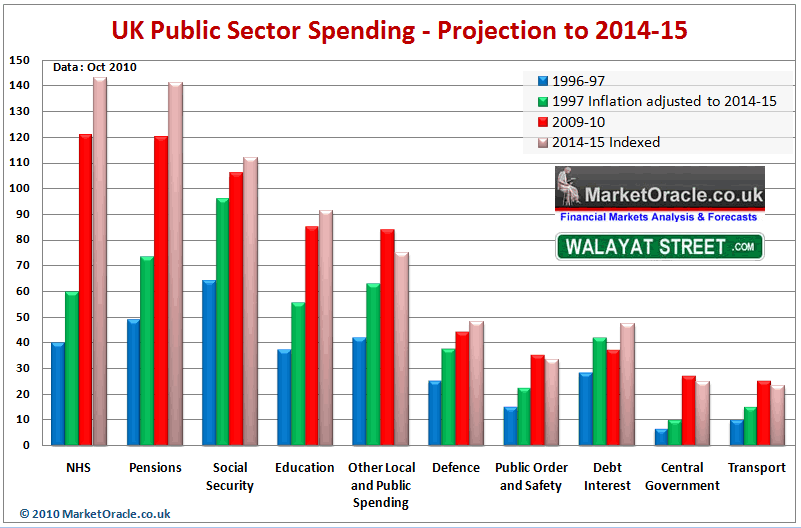
The graph shows that virtually every spending department will increase in nominal terms from 2009-10 to 2014-2015. Even budgets that have declared cuts of as much as 30% will barely see a nominal cut of 10%.
The fact is that EVERY year total UK government spending will INCREASE, from £680 billion for 2009-10 of to £739 billion for 2014-15, which is IF the government manages to achieve its spending cut targets as a more probable outcome is for far higher total government spending.
Clearly the coalition government has made a huge mistake in ring fencing the NHS, which under Labour had seen out of control spending and when coupled with pensions virtually accounts for the total increase in government spending over the next 4 years. The reason why NHS unions and worker representatives are demonstrating against NONE Existant cuts is because the NHS is so inefficient as an institution that just to stand it still requires annual increases of 7-8%, therefore INCREASING the NHS budget by approx 4% per year has a similar effect as a 3-4% cut, which illustrates why urgent reform if not outright privatisation of the NHS is still necessary to prevent this spending department from bankrupting Britain, as the NHS spending black hole succeeds in undermining all of the other spending cuts put together.
Britain's Debt Interest Spiral Continues
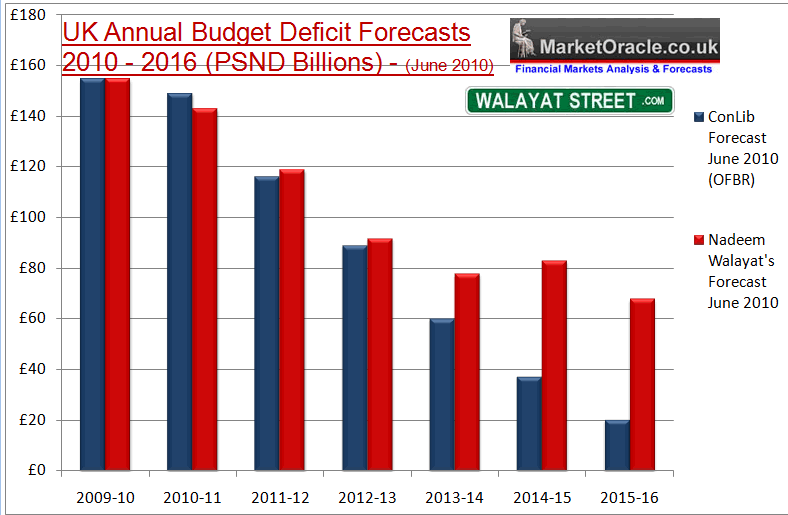
As mentioned in the June analysis (29 Jun 2010 - UK ConLib Government to Use INFLATION Stealth Tax to Erode Value of Public Debt ) the spending cuts will not prevent total UK debt from rising over the next 4 years by 50%. This is as a consequence of the budget deficit that will persist into the 3rd year of the cuts programme as illustrated below, which anticipates the abandonment of the cuts programme during 2013 as the Coalition government gears itself up towards generating an election boom into May 2015.
Therefore despite much anticipation in the mainstream media, the actual spending review does not contain any real surprises that alter Britains' path towards a debt mountain total of £1,262 billion for 2013-14, an increase of 50% on the 2009-10 total of £784 billion (as per original analysis of June 2010).
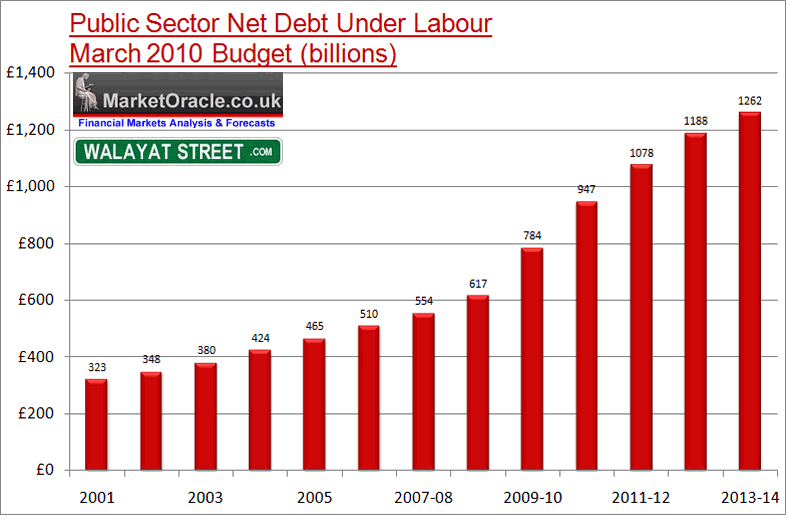
The impact of a 50% increase in total debt also implies at LEAST a 50% increase in ANNUAL debt interest payments to £70 billion a year up from £34 billion for 2009-10, which also illustrates how clueless are those that argue the Coalition government is cutting too much too fast, when the alternative is a Greece / Ireland style crisis a year or two down the road, resulting in the market demanding double or triple current interest rates for taking on the currency risk of lending to a country with an exploding debt mountain that it will NEVER repay in REAL terms as the debt burden would send inflation soaring and the currency plunging in an attempt at eroding the value of debt in real terms.
Public Sector Unemployment
The coalition government only presented half of the story on public sector job losses of 1/2 million, as they will be accompanied by an additional private sector jobs of upto 1/2 million. Whilst the coalition government estimates that as many as 2 1/2 million new private sector jobs will be created and therefore implying the public sector job losses will be more than covered by new jobs. However as earlier in depth analysis (01 Jul 2010 - UK Unemployment Forecast 2010 to 2015 ) explained that most of the new jobs, perhaps as high as 70% will go to migrant workers (as was the experience under Labour). Therefore contrary to coalition government expectations the spending cuts will result in far higher unemployment than optimistic government expectations for UK unemployment to fall to 2 million by 2015. Therefore my expectations remain as illustrated by the below graph for UK unemployment to rise to a high of 2.9 million by mid 2013.
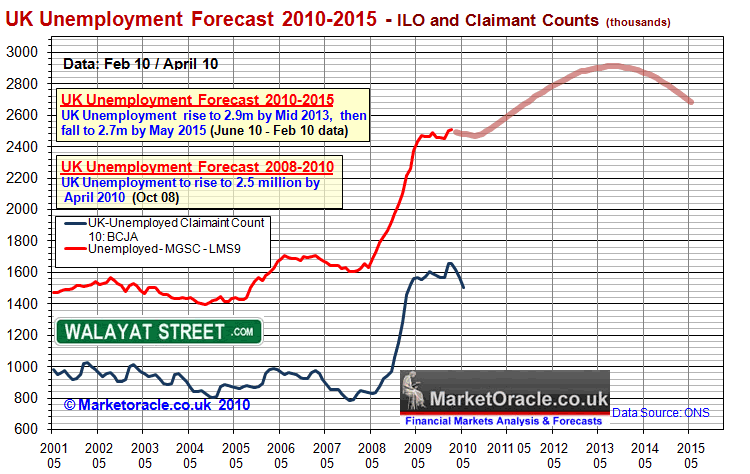
The best response from job hunters to the weight of a rising trend in unemployment for several years would be to start thinking outside the box and contemplating self employment / business startups as the coalition government has promised to foster a more business friendly environment by cutting red tape.
Impact of Benefit Cuts and Tax Rises
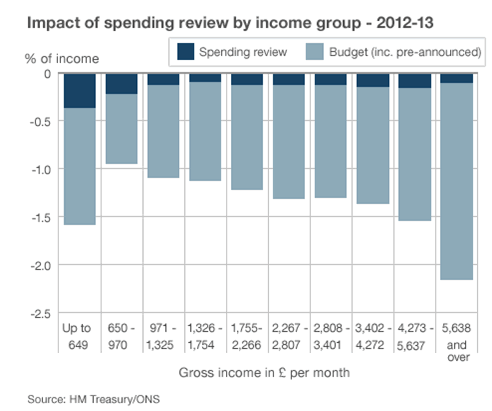
The tax rises and spending cuts combined hit middle income families with children the hardest due to tax rises and withdrawal of child benefit, whilst the least impacted will be employed single's and pensioners. The below graphs illustrate the impact in % terms on income groups and in total cash terms.
Percentage Income
Cash Impact

UK Inflation Stealth Tax and Wealth Theft
Inflation is a stealth tax that is being used by the Government and the Bank of England to a. Reduce the budget deficit (eroding purchasing power), and b. funneling tax payers and savers cash onto the balance sheets of the bailed out banks as savers are in receipt of interest net of tax at half the CPI rate and similarly average workers pay rise is near half the CPI and far below the RPI inflation measure of 4.6%.
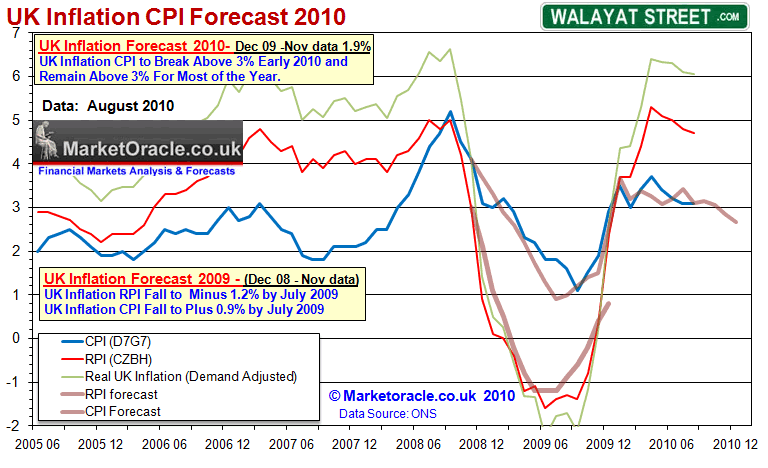
UK CPI Inflation at 3.1% for September 2010 is in line with my trend forecast for 2010 as of December 2009 that projected CPI above 3% inflation for most of 2010 (27th December 2009 UK CPI Inflation Forecast 2010, Imminent and Sustained Spike Above 3%) and the Inflation Mega-trend Ebook of January 2010 (FREE DOWNLOAD) as illustrated by the below graph.
Protect Your Wealth
At the end of the day capital taxes PLUS inflation are a means of taking accumulated wealth from the haves and redistributing to the have not's. Over the long run inflation ensures that those with accumulated wealth will ultimately lose most of it to the state (unless their funds are protected against UK inflation and taxation).
Unfortunately the coalition government has accelerated the trend of stealth theft by withdrawing the National Savings Index Linked Certificates in June, that allowed the people of Britain to at least protect upto £15,000 of their life time accumulated savings against RPI. Whilst also declaring a switch in annual indexation from RPI to CPI which means under reporting UK inflation by 1.5% against RPI and 3% against real UK inflation (6%).
The Bank of England is going to keep printing money which is a big positive for asset prices such as stocks. For investors the strategy remains to invest in inflation wealth protection and growth such as agricultural commodities, gold, silver, metals and mining, TIPS, emerging economies such as China, India, Russia, Chile, Brazil, and developed economies such as Australia and Canada as their appreciating currencies will protect your investments purchasing power in sterling as covered at length in the Inflation mega-trend ebook (FREE DOWNLOAD).
UK Economic Growth
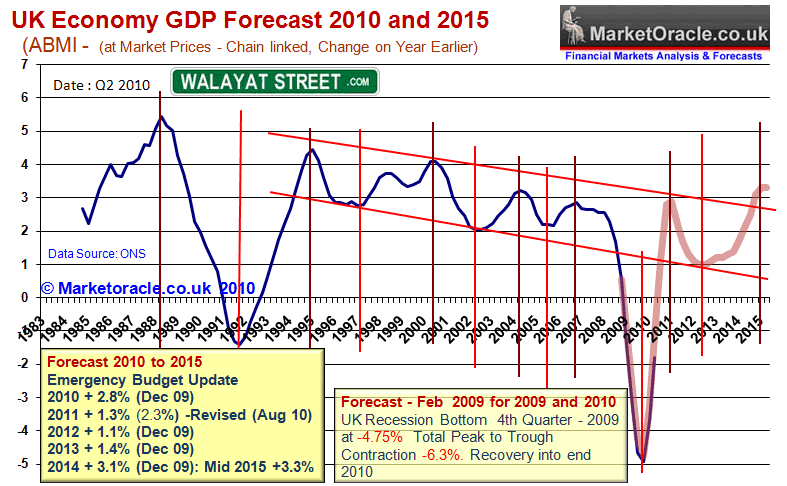
The announced spending cut details do not impact on my existing UK GDP growth forecast as updated in July 2010 (UK Economy GDP Growth Forecast 2010 to 2015). That projected the following GBP growth trend over the next 5 years.
- UK GDP 2010 2.8%
- UK GDP 2011 = 1.3%
- UK GDP 2012 = 1.1%
- UK GDP 2013 = 1.4%
- UK GDP 2014 = 3.1%
- UK GDP Mid 2015 = 3.3%
The big question is when will UK interest rates rise in the face of persistently high inflation which my forthcoming in depth analysis will seek to answer, ensure you are subscribed to my ALWAYS FREE Newsletter to receive this in your email in box.
Comments and Source : http://www.marketoracle.co.uk/Article23691.html
By Nadeem Walayat
Copyright © 2005-10 Marketoracle.co.uk (Market Oracle Ltd). All rights reserved.
 Nadeem Walayat has over 20 years experience of trading derivatives, portfolio management and analysing the financial markets, including one of few who both anticipated and Beat the 1987 Crash. Nadeem's forward looking analysis specialises on UK inflation, economy, interest rates and the housing market and he is the author of the NEW Inflation Mega-Trend ebook that can be downloaded for Free. Nadeem is the Editor of The Market Oracle, a FREE Daily Financial Markets Analysis & Forecasting online publication. We present in-depth analysis from over 600 experienced analysts on a range of views of the probable direction of the financial markets. Thus enabling our readers to arrive at an informed opinion on future market direction. http://www.marketoracle.co.uk
Disclaimer: The above is a matter of opinion provided for general information purposes only and is not intended as investment advice. Information and analysis above are derived from sources and utilising methods believed to be reliable, but we cannot accept responsibility for any trading losses you may incur as a result of this analysis. Individuals should consult with their personal financial advisors before engaging in any trading activities.
Nadeem Walayat Archive |
© 2005-2022 http://www.MarketOracle.co.uk - The Market Oracle is a FREE Daily Financial Markets Analysis & Forecasting online publication.


