


How to Play Gold Short-term Top with Options Calendar Spreads
Commodities / Gold and Silver 2010 Oct 19, 2010 - 06:29 AM GMTBy: J_W_Jones

 Recent price action in stocks and commodities reinforces the “don’t fight the Fed” mantra. What would our central bank be doing if it were not devaluing our currency, attempting to create inflation, and openly manipulating financial markets through a series of supposedly calculated open-market operations? I do not have any market prophecies; my crystal ball is on permanent vacation. The only certainty that presents itself is that the market pundits, the academics, and the analysts do not know exactly what is going to happen in the future.
We are in uncharted territory regarding government manipulation. We watch as our federal government actively and openly manipulates financial data in an attempt to boost asset prices with the hope that if Americans feel richer they will spend money more freely. What is going to be the catalyst to drive growth when the federal government and the Federal Reserve run out of manipulations?
By now the secret is out, the expected weakening of the U.S. dollar has propelled commodities and stocks higher in short order. The easy trade has likely passed and there are a few warning signs that are being largely ignored by the bullish masses. Business insiders are selling heavily while few are accumulating positions. The banks have not broken out and were under pressure for most of the trading day during Wednesday’s big advance. If the banks do not rally with the broad market, caution is warranted. We are approaching an uncertain period of time regarding earnings and the upcoming elections and we all know that financial markets hate uncertainty.
Additionally, the U.S. dollar is at key support and should that support level fail, stocks and commodities could continue their ascent in rapid fashion. If the level holds, the U.S. dollar could have a relief rally to work off the oversold condition, however a bounce will likely be short lived and the dollar will test and likely fail at that level. The chart below is the weekly price chart of the U.S. Dollar Index.
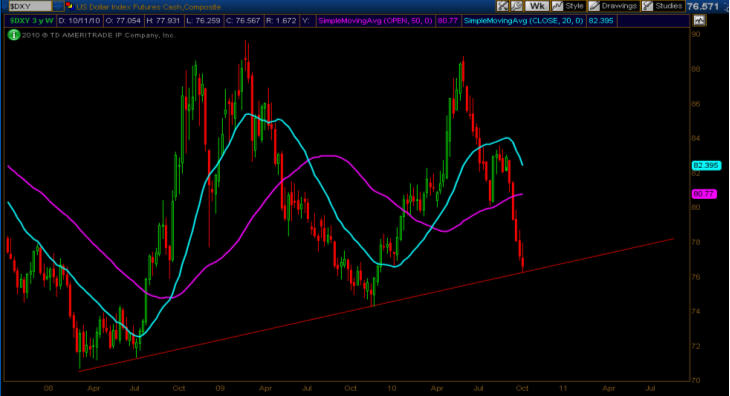
As the chart above indicates, the U.S. dollar is trading at critical support which offers traders a defined risk level. That being said, gold and silver have literally gone parabolic and are due for a pullback. With risk crisply defined on the other side of the dollar’s support level, a short trade on GLD is warranted. The only problem facing a directionally biased trade is that the November monthly options have nearly five weeks before they expire. Expiration is too far away to utilize an iron condor or butterfly spread, but a different option strategy might make sense.
After considering a few option construction strategies, a calendar spread makes a lot of sense. A calendar option trade, also known as a horizontal spread, is constructed using the same underlying, same strike price, but different expirations. A neutral strategy can be used where the primary profit engine is Theta (time) decay with no real price action expectation. Bull or Bear calendar spreads can be created through the purchase and sale of calls/puts that are out-of-the-money.
Since I expect the price of gold to decline due to a subsequent bounce in the U.S. dollar, I am utilizing a Bear Calendar Spread. The trade construction consists of selling the GLD October Weekly 134 puts (expire 10/22) and the simultaneous purchase of the GLD November 134 puts (expire 11/19). For our example, I will be using the Thursday (10/14) closing prices to illustrate this trade.
The GLD October Weekly 134 puts closed around $130 (bid) per contract (1.30) while the GLD November 134 puts closed trading at $320 (ask) per contract (3.20). The trade would represent a debit of $190 per side (1.90) not including commissions. The chart below illustrates the GLD Put Calendar spread. Please note that the maximum profit for this spread is always at expiration when the price of the underlying is at the strike price selected.
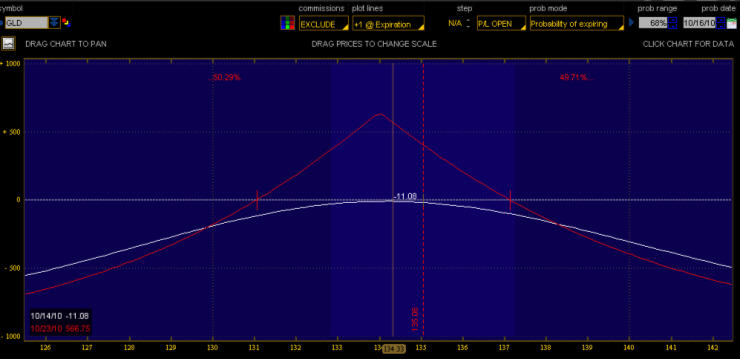
The profitability of the trade based on the Thursday closing price would be a maximum gain of $125 dollars per side assuming GLD’s price closed next Friday at exactly $134/share. The profitability range at Friday’s close is from $131.14 – $137.08. This trade takes on a maximum risk of $190 per side not including commissions. The profit potential based on risk is over 60% if price should close next Friday around 134.
But wait; there is more! The trader has additional choices after the trade has been placed. If GLD’s price stays relatively stable through the October weekly option expiration, the trade could be closed for a profit.
As mentioned above, the expectation is that the price of gold will decline as the dollar has a relief rally to work off the massively oversold condition. With that in mind, the trader could allow the GLD October Weekly 134 to expire next Friday or close that leg of the option trade keeping the long GLD November 134 put in place. After the October weekly contract is closed, the trader has the ability to put on a vertical spread or another calendar using the next week’s options.
In our case, we expect price to decline in the short term on GLD, so we could sell the GLD November 131 put and further reduce our overall cost of the GLD November 134 put that we are long. While this may sound a bit confusing, the main idea is that we are utilizing Theta (time) decay to reduce the cost of the long put we purchased. The further we are able to reduce the cost of the put, the more profitable a downward move in the GLD price becomes.
As an example, let us assume that we were able to close the GLD October weekly 134 put for a profit of $60. The profit reduces our overall cost on the GLD November 134 put by $60 and places the cost to us at $260. Assuming price stays relatively close to the Thursday close on GLD, we likely would be able to sell the GLD November 131 put for around $130 (estimate) depending on price action and volatility levels over the next week. Assuming we were able to sell the November 131 put at $130, we have now reduced our cost of the November 134 GLD put down to only $130 per side. The profitability chart below represents what the trade would look like.
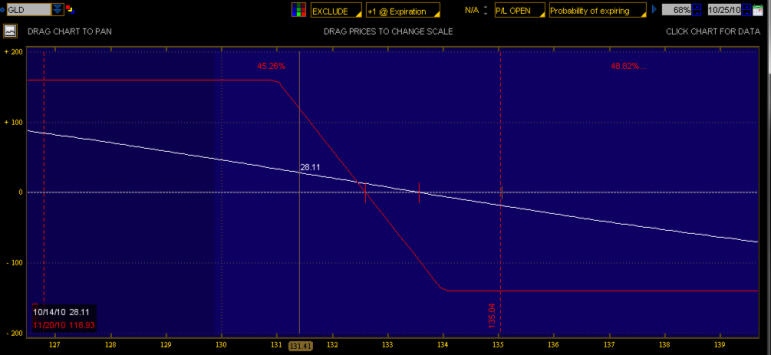
Now we have a directionally biased trade on GLD and we are only risking $140 per side for the exposure. The maximum gain on this trade at the November expiration would be $160 per side assuming GLD’s closing price was $131/share or lower at the November expiration.
The primary risk that this trade undertakes in relation to volatility would be a volatility crush, or collapse. If overall market volatility probes lower or the implied volatility declines on the underlying (GLD), it can cause a potentially damaging impact on this trade. With every trade there are inherent risks, but great traders understand the risk and manage it accordingly through the use of stop orders and proper position sizing (money management).
If GLD does sell off, it is likely that the implied volatility would increase on GLD which would benefit this trade tremendously. However, option traders must always be aware of implied volatility as it relates to the underlying being utilized in their specific trades. Ignoring implied volatility when trading options is like diving into a swimming pool head first without knowing how deep the water is.
While the longer term prospects for gold are quite constructive, in the short term it would be healthy for a pullback, even if only for a few days. This trade carries more risk than most strategies I have presented previously; however option traders need to be familiar with various methodologies that address current market conditions. Keep in mind, risk reducing strategies using contingent stop orders that are based on the U.S. Dollar index allow us to crisply define the risk in this trade. In closing, I will leave you with the insightful muse of Adam Smith, “The problem with fiat money is that it rewards the minority that can handle money, but fools the generation that has worked and saved money.”
If you would like to continue learning about the hidden potential options trading can provide please join my FREE Newsletter: www.OptionsTradingSignals.com
J.W. Jones is an independent options trader using multiple forms of analysis to guide his option trading strategies. Jones has an extensive background in portfolio analysis and analytics as well as risk analysis. J.W. strives to reach traders that are missing opportunities trading options and commits to writing content which is not only educational, but entertaining as well. Regular readers will develop the knowledge and skills to trade options competently over time. Jones focuses on writing spreads in situations where risk is clearly defined and high potential returns can be realized.
This article is intended solely for information purposes. The opinions are those of the author only. Please conduct further research and consult your financial advisor before making any investment/trading decision. No responsibility can be accepted for losses that may result as a consequence of trading on the basis of this analysis.
© 2005-2022 http://www.MarketOracle.co.uk - The Market Oracle is a FREE Daily Financial Markets Analysis & Forecasting online publication.