


As The World Markets Turn...
Stock-Markets / Stock Markets 2010 Oct 14, 2010 - 03:50 AM GMTBy: Steven_Vincent

As I review the landscape at this time, the key feature I am seeing at this juncture is that a number of key markets are playing in the vicinity of significant support and resistance. Some of these are areas of technical significance on a very long term or long term basis. Among the markets in question are: US Dollar Index, Gold, EuroDollar, DollarYen, EuroYen, Australian Dollar, SPX, NDX, World Leaders Index, SPX:30 Year Treasury Bond ratio.
The fact that a wide variety global markets are producing a confluence of significant technical conditions is most likely a signal that decisive moves are directly ahead. Astute traders will be able to recognize the message of the markets and act accordingly while the majority cling to ingrained views and only slowly accept the verdict.
The public discourse on future market direction has largely centered on the "Inflation or Deflation" dichotomy. It's not altogether clear that that conversational framework really captures the reality of this historical moment in the financial markets. Notably absent from the discussion is the potential for economic growth in the East and emerging markets and technological advancement in the West and developed economies.
My tendency at this time is to interpret the current setup in global markets as signaling the kickoff to a period of asset price inflation coupled with worldwide economic expansion. Whether this would be sustainable for any significant period of time is unclear and the potential remains that the end result would be yet another catastrophic (and probably much more severe) bubble collapse at some future date. Furthermore, this growth may be uneven, with the East leading and the West playing catch up.
The NYSE World Leaders Index takes the NYSE U.S. 100 and NYSE International 100 Indexes and combines them to form a global index of 200 stocks. With 100 of the NYSE’s largest U.S. company listings and 100 of its largest foreign company listings, the NYSE World Leaders Index has a float-adjusted market cap of $13.5 trillion. This represents 68% of the market cap of all stocks listed on the NYSE. Currently this index is trading at key long term horizontal resistance and just below its 50 Month and 200 Week EMAs after recently breaking its downtrend from the 2007 high.
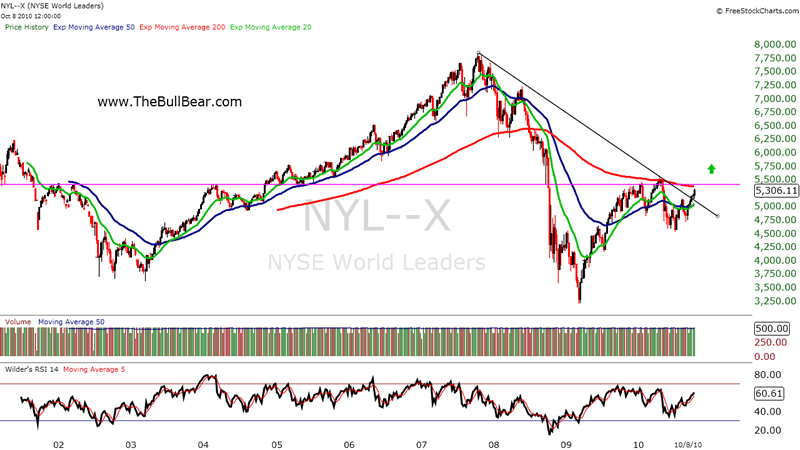
If this index is able to sustain its recent breakout and move above the 200 Week EMA then a significant rally is likely to ensue. A month or so later we would then be looking for a 50/200 long term bull cross to confirm the move. It's unlikely that such a rally would occur absent an expansion in world GDP. And this is what the chart appears to be forecasting at this time. On the other hand, a failure of the breakout and a move back below the 50 Week EMA would call such a scenario into doubt. The next few weeks should give us our answer.
Generally these reports as well as twice weekly video reports are prepared for BullBear Trading Service members and then released to the general public on a time delayed basis. To get immediate access just become a member. It's easy and currently free of charge.

Disclosure: No current positions.
By Steve Vincent
Steven Vincent has been studying and trading the markets since 1998 and is a member of the Market Technicians Association. He is proprietor of BullBear Trading which provides market analysis, timing and guidance to subscribers. He focuses intermediate to long term swing trading. When he is not charting and analyzing the markets he teaches yoga and meditation in Los Angeles.
© 2010 Copyright Steven Vincent - All Rights Reserved Disclaimer: The above is a matter of opinion provided for general information purposes only and is not intended as investment advice. Information and analysis above are derived from sources and utilising methods believed to be reliable, but we cannot accept responsibility for any losses you may incur as a result of this analysis. Individuals should consult with their personal financial advisors.
© 2005-2022 http://www.MarketOracle.co.uk - The Market Oracle is a FREE Daily Financial Markets Analysis & Forecasting online publication.