Intel's Technicals Ahead of Earnings Plus: What to Expect from the Semis
Stock-Markets / Stock Markets 2010 Oct 12, 2010 - 02:27 PM GMTBy: Mike_Paulenoff
After the close of trading Tuesday, Intel (INTC) comes out with its quarterly earnings, which could, or should, provide quite a catalyst (positive or negative) for the stock and its semiconductor sector and perhaps the market in general.
Last week you saw the cloud computing sector get clabbered because of a couple names in that sector. So, basically, the chip sector is having a bit of a problem, and Intel, being a very huge component of that sector of semiconductors, could have a major impact on the semis going forward. Intel pre-reported a little while ago, so most of the disappointment is out. Another disappointment on top of that certainly would be a sour turn of events for the semiconductors.
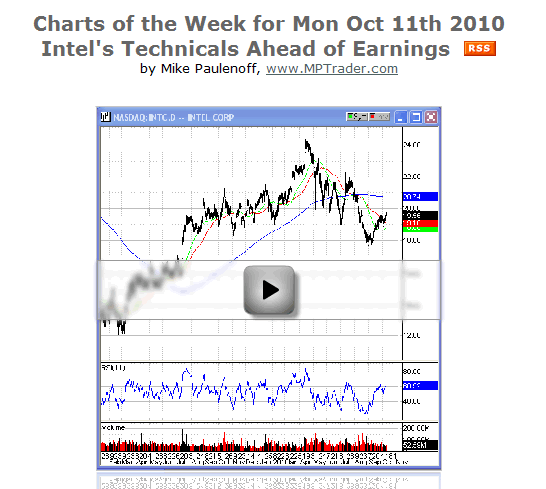
Intel closed Monday at 19.56 and was trading at 19.60 in the aftermarket. The daily chart shows the stock rallying from its February 2009 double-bottom low at 12 to a peak at roughly 24.40 in April. Intel went on the defensive into the August lows around 17.60, and, while rallying since then, has underperformed the upmove in the S&P 500.
Comparing Intel to the S&P 500 Depository Receipts (SPY), you see the SPY is now trading back up around where it was on May 12 of this year. Intel, on the other hand, is about 10% below the 22 1/2 level where it was on May 12. So Intel’s relative performance is a reason to be concerned.
Another reason is a tough resistance level it currently faces at its intermediate-term, down trendline off the April lows. If Intel is to get anything going on the upside, it needs to take out this trendline, which, give or take a few cents, is around 20-20.20. If it does that, then I can see it challenging the 200-day moving average at 20.75.
However, I think Intel is due to correct, whether it first rallies on good earnings news or sells off on bad.
A pullback under 19 would hit the trendline somewhere around 18.80 on the 4-hour chart. Then there’s the spike low that occurred on October 4, when the market flipped around after the correction, that comes in at 18.45. Somewhere in that area Intel should find a pullback low.
Keep in mind that Intel is a major part of the Semiconductor HOLDRs (SMH) ETF. At 20.4%, it’s actually the second largest component after Texas Instruments (TXN), which is 22%. Applied Materials Inc. (AMAT) is third at 11%.
The SMH looks much better than Intel, having already propelled itself off its 200-day moving average, while Intel has yet to break through its 200-day. But there are a series of rally peaks around 29 on its way down off the April high that could present some problems.
If the SMH can get through the 29 level, then it will not be held back by Intel and could really take off and go to 30 and retest the April highs.
Conversely, if in sell the news reaction, Intel doesn’t hold above 20, chances are the SMH will not be able to sustain above its key 29 level. If that happens, it will fail, break the support line, and probably come back into the 26 area. That's a 60% retracement of the upmove (from 24 to 29) off of the August lows, and a level from which it should take off again.
Sign up for a free 15-day trial to Mike's ETF & Stock Trading Diary today.
By Mike Paulenoff
Mike Paulenoff is author of MPTrader.com (www.mptrader.com), a real-time diary of his technical analysis and trading alerts on ETFs covering metals, energy, equity indices, currencies, Treasuries, and specific industries and international regions.
© 2002-2010 MPTrader.com, an AdviceTrade publication. All rights reserved. Any publication, distribution, retransmission or reproduction of information or data contained on this Web site without written consent from MPTrader is prohibited. See our disclaimer.
Mike Paulenoff Archive |
© 2005-2022 http://www.MarketOracle.co.uk - The Market Oracle is a FREE Daily Financial Markets Analysis & Forecasting online publication.


