Global Stocks Set to Surge Higher
Stock-Markets / Global Stock Markets Oct 11, 2010 - 06:00 AM GMTBy: Money_Morning
 Jon D. Markman writes: Indices across the world rose last week in what looks to be the beginning of a historic stock rally.
The Standard & Poor’s 500 Index rose 1.6% last week, while the overseas developed-world large-caps - represented by the Vanguard FTSE All-World ex-US exchange-traded fund (NYSE: VEU) - rose 2.4%. Meanwhile, the iShares Emerging Markets ETF (NYSE: EEM) rose 1.7%, the iShares FTSE/Xinhua China 25 Index (NYSE: FXI) rose 3%, the iShares MSCI Switzerland Index fund (NYSE: EWL) rose 3%, and the iShares MSCI Australia Index Fund (NYSE: EWA) rose 3.6%.
Among our favoried emerging markets and sectors, iShares MSCI Turkey Index Fund (NYSE TUR) blasted 6.5% higher, the Market Vectors Latin American Small Cap Index Fund (NYSE: LATM) rose 3.5% and Market Vectors India Small Cap Index Fund (NYSE: SCIF) rose 2.4%. The SPDR Gold Trust (NYSE: GLD) rose 2.1% and the Market Vectors Junior Gold Miners ETF (NYSE: GDXJ) rose 2.6%.
this was just a good week to be invested overall -- it almost did not matter where.
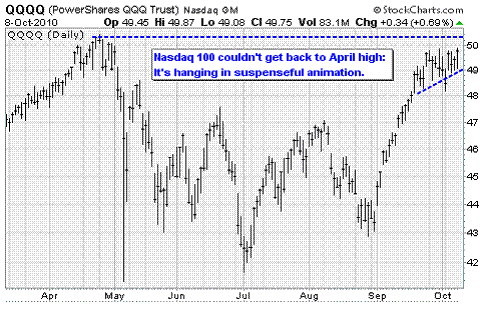
I really hope you are participating, and not just watching, because this is historic stuff. I promised an epic beta chase if a short-covering rally got started in the fourth quarter, and that is just what we have. The Nasdaq 100 almost got back to its April highs, and the fact that it didn't is going to weigh on the minds of both bulls and bears as they approach the coming week. So close, yet so far.
There are a lot of people on the outside of the market looking in, and they want their piece. If there is one thing that people in capitalist countries hate more than losing money, it's losing an opportunity to make easy money. And while this has not exactly been easy, it probably looks that way to people who have not done their homework and started back in the early summer.
Now you knew there had to be some bad news, and of course there was. Nothing great comes without a price. It's this: Your ability to buy anything with the profits of those advances fell by 0.8% on Tuesday as the dollar crashed another 0.8%. Oh man, they are just crushing the buck.
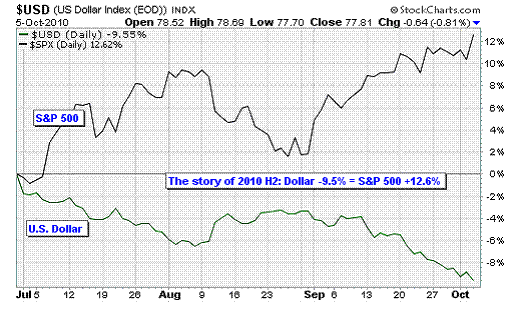
Remember that I said back in late August that if the dollar fell below its 200-day average, the market would take off like a ball off the bat of Alex Rodriguez? Well, that happened in early September, and ever since it has been. You can see in the chart above that much of the story of the second half of 2010 can be explained by the decline in the value of the dollar.
The cause of the dollar's drop is well known to us by now, but just as a refresher here is the short version: High-debt countries like Japan and the United States want to stimulate their economies without going deeper into debt. So they are using the only tool that doesn't have a direct cost in their budgets: devaluing their currencies via methods they delicately call "quantitative easing," but could just as easily be called "printing money to buy other paper assets."
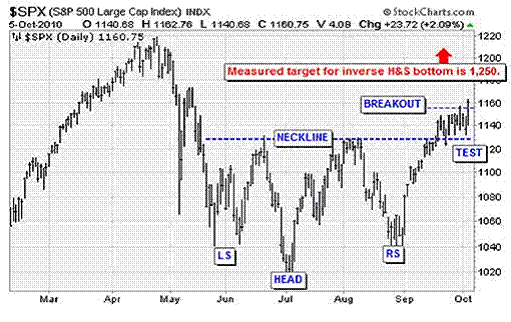
Although this seems crazy to us as citizens, this direct attempt to debase the currencies to make debts cheaper is loved by the markets. Go figure. The chart above shows an updated version of the inverse head-and-shoulders bottom that we've been discussing since late August. The bullish reversal pattern was "validated" with a move above the neckline in mid-September, then revalidated with a successful "test" last week -- and is now on to a new breakout today.
Technicians determine a target for a move like this by determining the distance in points from the neckline to the head, and adding that to the neckline. In this case, it's 120 points, so the target is 1,250. That may all sound like voodoo, but it's proven to be a very good rule of thumb for me over the years. And like a lot of technical analysis, sometimes it works just because everyone believes it works.
One reason that money is flooding in to the market is that many major hedge funds missed the September rally. The San Francisco research firm TrimTabs reported that its survey of hedge fund managers conducted in early October with a unit of Barclays found that only 31% were bullish on the S&P 500. Furthermore, only 37% of the 109 hedge fund managers surveyed in the past two weeks were bullish on any other kinds of stocks either, while 32% were neutral.
Keep in mind that this is supposed to be the smart money, and yet most have not participated in one of the most epic advances in stocks in the past decade. How could that be?
My sources say the September surprise in stocks may actually have been engineered and dominated by sovereign wealth funds, such as the ones operated by the governments of Singapore and Kuwait -- and caught short-sellers and uninvested investors flat-footed. The first stage of a beta chase occurs when short-sellers cover their bad bets in bursts.
Now it's one thing to cover, because that only saves you from losing money. The next stage is to reluctantly buy, and then to start getting with the program and borrowing to buy, and then finally to leverage and buy enthusiastically. This can happen even in a weak economy, as it did in 1995, because hedge fund managers are paid for performance, and they can absolutely, positively not let a big advance happen without them. They will add leverage until their fingers bleed from hitting the Get Me in Now! button.
"While managers dislike stocks, bonds, and the greenback, many aim to lever up," said Vincent Deluard, an exec at TrimTabs. "Short rates are essentially zero, the 10-year Treasury yields a scant 2.5%, and real interest rates are negative. Where there's an incentive to increase leverage, managers will act."
Yes they will. And you know what? Here's a surprising truism provided by none other than Alan Greenspan. Last week he suggested in an interview that a stock market rally might be the best economic stimulus. That's because confidence is the key missing ingredient from the economy at present, particularly for employment -- and a market rally could help confidence a lot, according to analysts at ISI Group. The analysts note that there has been a 90% correlation between holiday sales and the stock market, and a rally would also help house prices. (Of course a decline would reverse all three.)
Here is the possible positive chain of events, as put forth by ISI on Monday: (1) The Fed discusses/implements quantitative easing. 2) The stock market rallies. 3) Consumer confidence increases. 4) Retail sales increase. 5) Unemployment claims decline as business improves and business confidence increases.
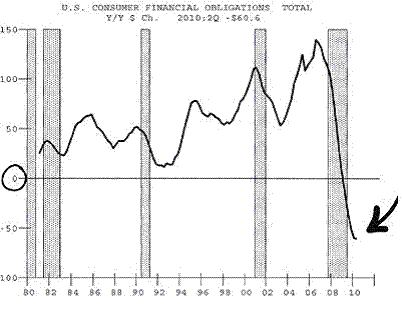 Helping this along is further consumer deleveraging that could help households spend more freely for Halloween, Thanksgiving and the gift-giving holidays this winter: Financial obligations (debt payments, rents, auto lease payments, property taxes and homeowners insurance), which totaled $1.9 trillion in the second quarter this year, were down by $61 billion in the last three months, a record by a large margin. The next step is for something like $50 billion of that to be spent, if ISI regression models are valid.
That would provide a more solid fundamental underpinning for an advance. But remember that the most important thing about increased confidence is that price/earnings multiples rise -- making stocks more valuable not because they are earning more now, necessarily, but because investors believe that they will do so in the future.
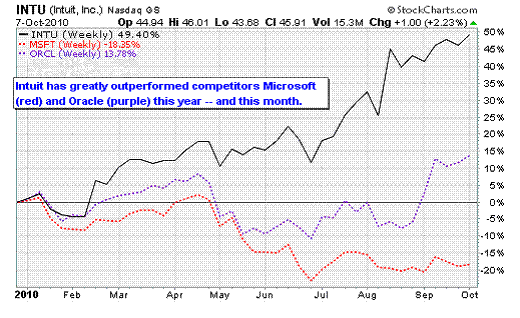
One of the more interesting companies making a new one-year and five-year high for us was Intuit Inc. (Nasdaq: INTU), the maker of QuickBooks software, which is one of my recommended positions. In the chart above you can see that it is up almost 50% already this year and still going strong, but what you may not realize is that INTU is also one of the strongest software companies the Nasdaq began to crash a decade ago.
In fact, it is up 57% from March 10, 2000, the day the Nasdaq topped, while industry peer Microsoft Corp. (Nasdaq: MSFT) is down 40% and Oracle Corp. (Nasdaq: ORCL) is down 31%. Intuit still in great shape seasonally and technically, and will report earnings on Nov. 18.
The Week That Was
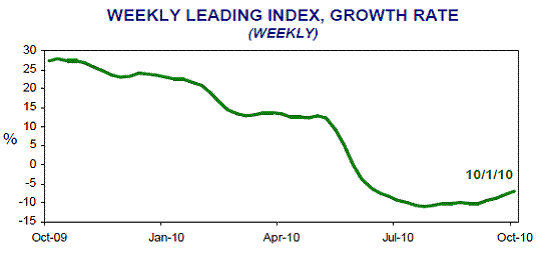
-- The ECRI Weekly Leading Index continued to improve, its growth rate up-shifting to -7.0% from -7.8%. That's almost another percentage point, which is a lot. As you know, this is my favorite forward-looking measure because of its proven ability to look around corners. The WLI is forecasting a moderation in the slowdown of U.S. GDP growth. That's not yet the same as an acceleration, but give it time. As I've said the past few weeks, when the WLI turns higher like this, it's always unexpected and disbelieved -- and that is when you can reap the best rewards.
-- Labor market remains quite sluggish, though not as bad as the Friday headline made it seem. Overall non-farm payroll employment in September fell 95,000, following a revised 57,000 dip in August and a 66,000 decrease in July. That was a lot worse than the consensus expectation of a -10,000 decline.
-- Weakness was mostly in government jobs as federal and municipal payrolls declined 159,000 after decreasing 150,000 in August. That was mostly Census workers, but local government is also softening with budget shortfalls, down 76,000 in September after falling 11,000 in August. More teachers are being fired as at the local level, as educational services jobs fell by 49,800 in the latest month.
-- On the positive side, private employment continued to rise, advancing 64,000 in September, following a revised increase of 93,000 the prior month. The median market forecast was for an 85,000 boost for private payrolls. The rise was led by a 38,000 boost in leisure & hospitality jobs -- eat, drink and be merry while you wait for a job to appear, I guess. Goods-producing jobs fell 22,000 after a 10,000 increase in August. Manufacturing slipped 6,000 while construction jobs dropped 21,000. Mining rose 6,000.
-- Average hourly earnings were unchanged in September after rising 0.3% in August. The September figure fell short of the market estimate for a 0.1% gain. The average workweek for all workers was steady at 34.2 hours in September, matching expectations.
-- The bad news was that a broader measure of underemployment rose again up as the percent of unemployed that are marginally attached to the labor force, or are working part time only because they can't find a full-time job rose to 17.1% in September from 16.7% in August. That's only slightly below the recent high of 17.4% a year ago. Not good.
 -- Bottom line: Business demand for labor is absolutely anemic. Keep in mind that was the last look at employment before the mid-term elections on November 2.
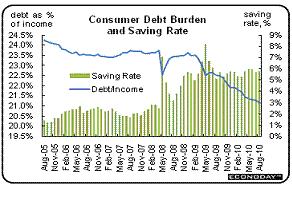
-- Consumer credit outstanding shrinking. Consumer credit card debt fell $3.3 billion in August, with revolving credit (i.e. cards) down $5 billion and non-revolving ( to decline in August, shrinking $3.3 billion in August with revolving credit down a sizable $5.0 billion. Non-revolving credit, led by car loans, rose $1.7 billion in August. Why is credit card use down? Two reasons: People have decided to pay down debt, and spend out of current income instead of on credit -- but also, banks are writing off bad debt as unemployed workers are unable to keep up with payments.
-- While people are putting more on credit, they are saving more. And that is a good thing because eventually that money will go into investments and help prepare for retirement.
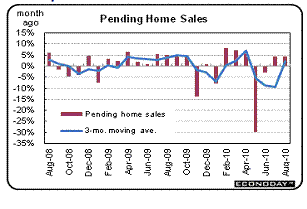 -- Pending home sales are rising again after crashing once the tax credits ended. It's a really small bounce though, so nothing to get excited about yet. They're also down 20% from August 2009. Pending home sales are a leading indicator for existing home sales as they are based on contract signings while existing home sales reflect closings.
-- An index of activity at non-manufacturing companies surprised on the upside just a little, but it's something. A modest rebound in new orders and employment were key.
-- Bottom line for the past week was not economic indicators, though. It was renewed speculation that global central banks would flood the system with money to ease business conditions. It was all kicked off by the Bank of Japan on Monday, and followed up by Bernanke comments here. But who would really notice if the effective Federal Funds rate went to say 0.15% from 0.25%? Banks, and that's about it.
-- There is no shortage of cheap money already, but as I have said before the problem is that banks won't lend until conditions improve and the government isn't forcing them to. So we're going to continue to have this weird condition where the stock market and economy diverge. If you love paradoxes, this is your environment.
The Week Ahead
Fed meeting minutes will kick off the week on Tuesday, and then we'll get an international trade report on Thursday and a retail sales report Friday. Along the way, earnings season will get rolling.
Monday: No major economic reports planned.
Tuesday: Sept. 21 Fed meeting minutes will be released, so we'll learn more about the internal dissention to the chairman's interest in easing further.
Wednesday: U.S. Treasury will report the deficit. It will be big.
Thursday: The U.S. international trade gap. In July it narrowed, which is good. But it'll probably widen due to higher energy imports. Initial jobless claims will be reported too. The last couple have shown improvement. Producer price index, a measure of inflation, will be reported. Look for a rise of 0.1%.
Friday: The consumer price index will probably will come in around 0.2%, which is non-scary. Retail sales for August will be reported. They rose 0.4% in August, led by sales of gasoline station's food and beverage. I guess people are dining out at the convenience stores. Consensus is +0.5%; my model says +0.6%. Reuters/Umich consumer sentiment index also comes out. With hiring weak, expect a disappointing number.
[Editor's Note: Money Morning Contributing Writer Jon D. Markman has a unique view of both the world economy and the global financial markets. With uncertainty the watchword and volatility the norm in today's markets, low-risk/high-profit investments will be tougher than ever to find.
It will take a seasoned guide to uncover those opportunities.
Markman is that guide.
In the face of what's been the toughest market for investors since the Great Depression, it's time to sweep away the uncertainty and eradicate the worry. That's why investors subscribe to Markman's Strategic Advantage newsletter every week: He can see opportunity when other investors are blinded by worry.
Subscribe to Strategic Advantage and hire Markman to be your guide. For more information, please click here.]
Source : http://moneymorning.com/2010/10/10/stock-rally/
Money Morning/The Money Map Report
©2010 Monument Street Publishing. All Rights Reserved. Protected by copyright laws of the United States and international treaties. Any reproduction, copying, or redistribution (electronic or otherwise, including on the world wide web), of content from this website, in whole or in part, is strictly prohibited without the express written permission of Monument Street Publishing. 105 West Monument Street, Baltimore MD 21201, Email: customerservice@moneymorning.com
Disclaimer: Nothing published by Money Morning should be considered personalized investment advice. Although our employees may answer your general customer service questions, they are not licensed under securities laws to address your particular investment situation. No communication by our employees to you should be deemed as personalized investent advice. We expressly forbid our writers from having a financial interest in any security recommended to our readers. All of our employees and agents must wait 24 hours after on-line publication, or 72 hours after the mailing of printed-only publication prior to following an initial recommendation. Any investments recommended by Money Morning should be made only after consulting with your investment advisor and only after reviewing the prospectus or financial statements of the company.
Money Morning Archive |
© 2005-2022 http://www.MarketOracle.co.uk - The Market Oracle is a FREE Daily Financial Markets Analysis & Forecasting online publication.


