


Currency Time Cycle's Analysis for U.S. Dollar, Euro, Yen and Swiss Franc
Currencies / Forex Trading Oct 07, 2010 - 04:02 AM GMTBy: Tony_Caldaro

 For many a year we have spent most of our time trading the markets using OEW and not paying too much attention to time cycles. We naturally accepted the four-year presidential cycle because it was easily back-tested using OEW analysis. And, with very few exceptions it has been quite predictable and regular.
When examining the bull market in gold in recent years in OEW terms, we uncovered a regular 34-year commodity cycle. Then when we overlapped this commodity cycle on the historical OEW stock market chart we found that it too unfolds in a, somewhat coincident, 34-year secular cycle. Recently we reported about finding the elusive 2-year product cycle in the tech sector. Then a couple of weeks ago we reported about a 68-year, (double 34), cycle in interest rates. The quantitative feature of OEW allows us to view markets with a different perspective. Naturally, since we have now covered and reported on, three of the four major financial assets, our next target was number four: the currencies. And, to little surprise the 34-year cycle is at work there as well.
Unfortunately, unlike stocks, commodities, and interest rates, currencies have only been floating for 40 years. With such a small sample we can not be certain if the typical 34-year cycle is definitely at work, or one of its harmonics, the 17-year cycle, is the main cycle. Since stocks and commodities move in 34-year cycles, and interest rates in a 68-year cycle, then a 17-year cycle for currencies is certainly synchronous. And, this cycle is easily identified.
In our research we were able to get historical charts, (1970-present) on most of the major currencies we follow: USD, CHF, JPY, GBP, AUD, ZAR. Plus the DEM from 1970-2005 and the new DEM, I mean EUR from 1998. No historical data on the CAD yet. In this report we are going to cover, in detail, the USD, CHF, JPY, EUR and DEM. Since the AUD and ZAR were both being devalued from 1974-2001, (37-years), and the GBP has been in a 25 year trading range, we’ll leave these three for another time.
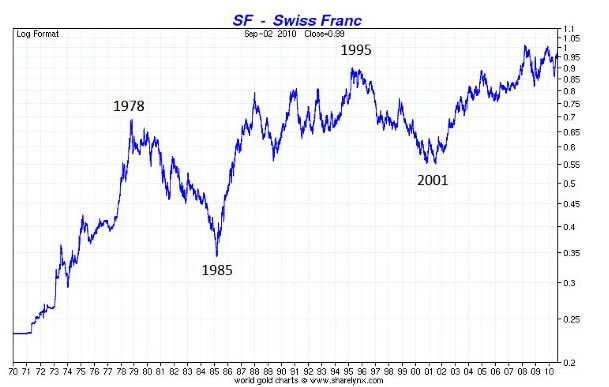
The first chart in this analysis is the CHFUSD. Note since 1970 two major tops occurred exactly 17 years apart: 1978 and 1995. Then notice that two major bottoms occurred 16 years apart: 1985 and 2001. We will also state at this time the wave patterns of each bull (rising) and bear (declining) market was corrective ABC’s. Currencies do not move in impulse waves longer term. Since every currency is paired, impulse waves are not probable.
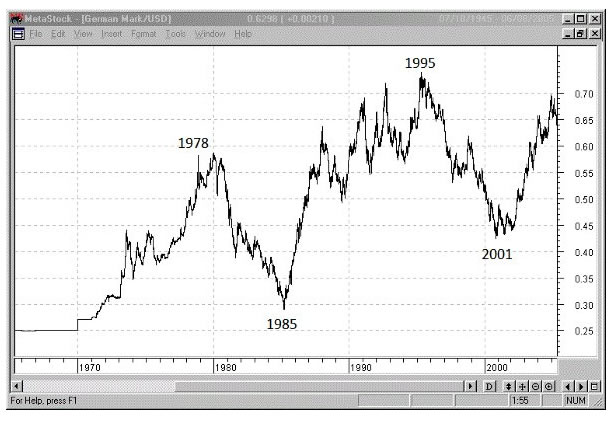
The second chart is the DEMUSD. Note a similar pattern to the CHFUSD. Here again we have two major highs: a spike peak in 1978, (followed by a 1980 secondary peak), and 1995. Then again two major lows: 1985 and 2000, (followed by a 2001 secondary low). Again we have within one year the same pattern as the CHFUSD.
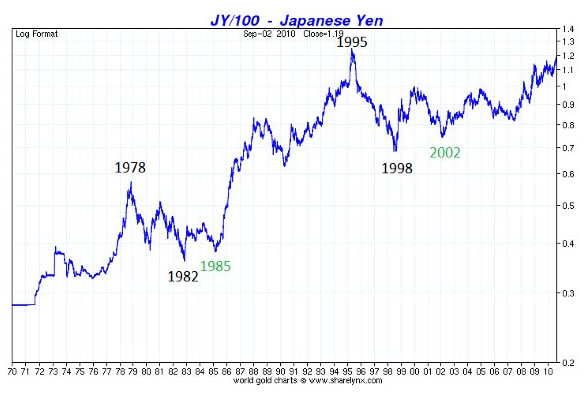
The third chart is the JPYUSD. We’re doing these three currencies first because they all move generally in the same direction, while the USD, (which is next), moves in the opposite direction. Here again there are two major tops exactly 17 years apart: 1978 and 1995. The two major lows, however, are a bit shifted when compared to the CHF and DEM: 1982, (followed by a 1985 secondary low), and 1998, (followed by a 2002 secondary low).
The four chart is the EURUSD. Since we have limited data, 1998-present, we can only identify a significant, well remembered, low in the 2000-2002 bottoming process. The EUR started trading in the middle of the foreign currency 1985-2002 bottom to bottom cycle. Since then it has been rising in the 1995 to present top to top cycle. Notice the EUR bottomed with the DEM, the CHF and the secondary low in the JPY. When combining these four currencies we can observe tops occurring 17 years apart and bottoms between 16-17 years. Let’s just call it a 17-year cycle top to top: 1978-1995-present, and a 17-year cycle bottom to bottom: 1985-2002, within one year either way.
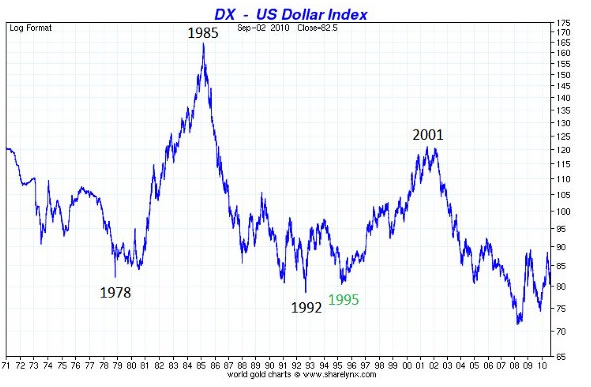
The fifth chart is the USD or DXY. The DXY represents a weighted index of the USD against six currencies: EUR, JPY, GBP, CAD, SEK and CHF. Notice the two major bottoms are in line as the inverse of the major tops in the CHF, DMK and JPY: 1978 and 1992, (followed by a 1995 secondary low). Now note the two major tops are in line as the inverse of the bottoms in the CHF, DEM and JPY: 1985 and 2001, (followed by a 2002 secondary high). Clearly there is a 17-year cycle at work, either top to top or bottom to bottom, depending on which currency you are tracking.
Conclusions
The 17-year up cycle in the foreign currencies suggests that they will generally rise until 2012, 1 year. Therefore, the USD will generally decline until 2012. When we relate this 17-year cycle to the commodity, stock, and interest rate cycles, we notice that they are generally in alignment.
Our recent report of a stock bull market top in 2012, is supported by the inverse relationship of stocks to the USD: Stocks rise while the USD declines.
Our long standing view of a commodity peak in 2014 is also supported by the USD. Notice the low in the USD, during the last commodity bull market, occurred in 1978. Two years before the peak in the commodity cycle in 1980. Also, notice the USD bounced around a bit until the commodity market peaked, and then took off to the upside.
Finally, after the last commodity bull market, which was accompanied by inflation and an interest rate peak in 1981. The USD soared, more than doubled, in just five years as investors worldwide were buying US Bonds at double digit rates, while rates were declining. It takes dollars to buy US Bonds. This time around, during this commodity bull market, interest rates are low and the inflationary pressures of rising commodity prices are offsetting the deflationary pressures of debt contraction. This suggests when interest rates bottom in 2015, the then rising USD will probably only make it back to its equilibrium point of 120 in the DXY. If the DXY bottoms around 60, in 2012 or so, this would then imply a double to 120 by 2019. With less than two years to go, this being October 2010, and lots of currency intervention by the Central Banks. The USD may only drop to just below 70 before the FED is intervening again like they did at the last new low in 2008.
Now we have the 2-year, 4-year and 34-year stock market cycles to track. Along with the 34-year commodity cycle, 68-year interest rates cycle, and 17-year currency cycle. Best to your investing!
By Tony Caldaro
http://caldaroew.spaces.live.com
After about 40 years of investing in the markets one learns that the markets are constantly changing, not only in price, but in what drives the markets. In the 1960s, the Nifty Fifty were the leaders of the stock market. In the 1970s, stock selection using Technical Analysis was important, as the market stayed with a trading range for the entire decade. In the 1980s, the market finally broke out of it doldrums, as the DOW broke through 1100 in 1982, and launched the greatest bull market on record.
Sharing is an important aspect of a life. Over 100 people have joined our group, from all walks of life, covering twenty three countries across the globe. It's been the most fun I have ever had in the market. Sharing uncommon knowledge, with investors. In hope of aiding them in finding their financial independence.
Copyright © 2010 Tony Caldaro - All Rights Reserved Disclaimer: The above is a matter of opinion provided for general information purposes only and is not intended as investment advice. Information and analysis above are derived from sources and utilising methods believed to be reliable, but we cannot accept responsibility for any losses you may incur as a result of this analysis. Individuals should consult with their personal financial advisors.
© 2005-2022 http://www.MarketOracle.co.uk - The Market Oracle is a FREE Daily Financial Markets Analysis & Forecasting online publication.