


Gold and Silver, It Could Well be a Whole New Ballgame!
Commodities / Gold and Silver 2010 Oct 04, 2010 - 08:38 AM GMTBy: Peter_Degraaf

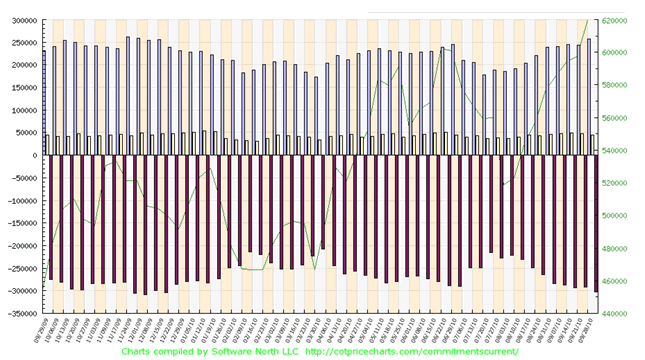
 The most recent COT (Commitment of Traders) report (chart courtesy Cotpricecharts.com), shows the ‘net short’ position of commercial gold traders to be at its highest level since December 18th 2009 (purple bar at far right). In the past whenever the number rose to the level of the last three weeks (300,000 see table at left), a correction soon followed. Not so much because of the large number of short positions (because these will eventually have to be covered), but because of the large number of long positions (blue-grey vertical bars), representing gold that is held for the most part by hedge funds. Many of these hedge funds use computer generated trading programs which kick in with a domino effect. Once a few begin to take profits, they all try to exit at the same time.
At the present time the price of gold does not seem to be intimidated by the large COT “net short’ number, as in the past. Could it be that the hedge fund operators and large investors sense a possibility that the commercials are ‘on the ropes’? Some of these commercial traders have carried a large short position for many months. All of these short positions are now ‘under water’. Every time gold rises, the holders of short positions have to raise margin money or buy back a losing position. The upward pressure on price is due to fundamentals for gold that are extremely bullish and these include:
• The US money supply is today twice as large as it was just a few years ago.
• The Obama administration is without a clear economic policy – three out of four members of the economic team have just resigned - and the fourth, Tim Geithner, has never held a position in the business world aside from being involved in the banking business at Goldman Sachs. The man can’t even keep correct personal income records.
• Worldwide money supply is expanding at an average rate of 10%.
• The US dollar is in a long-term decline against gold (see chart below).
• The Euro is in a long-term decline when measured in gold (see chart below).
• Gold is rising not only in US dollar terms but also as expressed in a number of currencies – this reflects a ‘flight to safety from fiat currencies.’
• Gold production is declining, despite higher prices.
• It takes longer (due to regulations) to build a gold mine than ever before, and the rising cost of materials and fuel makes it very expensive to build a mine.
• The period between US Labor Day and Christmas is usually the most gold-bullish period of the year. In seven of the last eight years gold rose during this period.
• The expiration of options on August 26th did not have a negative effect on the gold price, compared to options expiration days in June and July. This proves strong underlying physical demand.
• China is buying up local gold production, thus withholding it from the market.
• Russia is buying up local gold production, thus withholding it from the market.
• Gold ETFs are more popular than ever before, drawing bullion away from the market.
• The US gold supply that is stored at Fort Knox has not been audited since 1953 and is most likely all or partly gone. It has either been sold or leased.
• Central banks have stopped selling gold and some have become buyers.
• Gold thrives when ‘real interest rates” (US T-bill rate less CPI) is negative - as now. (People who are earning less than 7% per year on an investment are actually going backwards because of the inflationary effect which is currently 7% and rising!) Gold on the other hand has been rising at an average +20% per year for the past five years. Since 2001 gold has risen 400%!
• Gold thrives during periods of price inflation and we are witnessing the beginning of increased price inflation: Wheat, corn, oats, barley, oranges, cattle, hogs, salmon, copper, iron ore, cotton, sugar, coffee, palm oil, health care, education are just some of the categories that are rising in price.
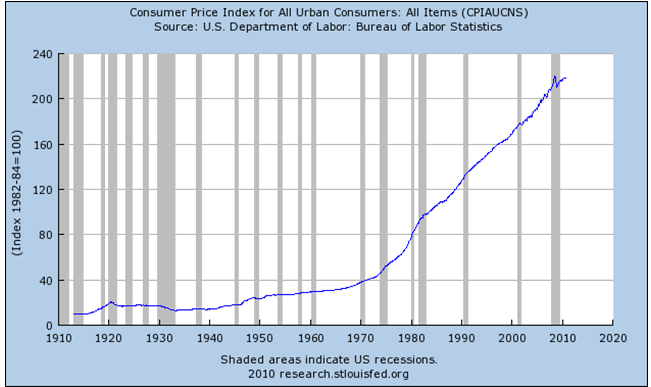
This chart courtesy Federal Reserve Bank of St. Louis shows price inflation is rising again after a short respite in 2009 following the credit crisis. Price deflation only lasted for about a year! (This chart is based on official figures. Mr. John Williams at Shadowstats.com has calculated price inflation to be rising at 7% per year). Statements made by government officials need to be taken with a ‘grain of salt.’ Mr. Victor Zarnowitz, a professor at the University of Chicago is an expert on business cycles. He studied the predictions made by US government officials including the Federal Reserve bankers. He discovered that 92 out of 100 predictions turned out wrong.
The Elliott Wave guru’s have cost a lot of people a lot of money.
The Elliott Wave crowd and the ‘deflationists’ are doing their subscribers a disservice. They seem to have forgotten that the amount of new money ‘creation’ that has taken place on a worldwide basis since 2008 is unprecedented! With this much money floating around you cannot just pull up a chart, draw in a few lines and predict that gold is going to drop in price! The correct interpretation of a chart requires knowledge of the fundamentals combined with technical analysis. DID YOUR ANALYST ADVISE YOU TO SELL YOUR GOLD WHEN THE CURRENT RALLY BEGAN? IF SO – WHY NOT FIRE HIM OR HER!
On Oct 1/1940 Ralph N. Elliott wrote an educational bulletin titled: “The Basis of the Wave Principle.” Thus was born the Elliott Wave Method of Technical Analysis. Today thousands of people try to get rich using this method of predicting the future of stocks and commodities. There is no evidence that Elliott ever made any money from putting his theories to practice in the investment world. Some of Elliott’s current followers have been predicting for years that gold is going down in price and people are losing money by following these stubborn people. People who rely on Elliott Wave theory while disregarding fundamentals are like people who drive a car while looking only in the rear view mirror! To find out if your analyst is worth following, find out what he or she has told you in the past! Virtually every website has archives that you can visit to check out the person’s predictive history.
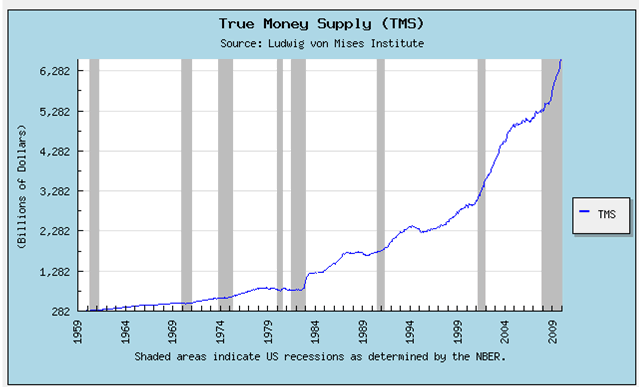
Featured is the True Money Supply chart courtesy Mises.org. This chart represents the Austrian School of tracking money supply consisting of currency checkable deposits and savings deposits. As can be seen in this chart TMS continues to rise exponentially. Monetary inflation begets price inflation just as night follows day – always has, always will. The US federal Government debt between 1776 and 1980 totalled 980 billion dollars. Mr. Obama is running annual deficits greater than that. These deficits cannot be covered by taxes. They will be inflated away. It’s baked in the cake. This predicts ever increasing monetary inflation!
“Just like street drugs, the more you take the less effective they become. Fiscal and monetary stimulus is now barren, except for its destruction of currencies”. …. Jim Sinclair.
“Kimberly-Clark (KMB: NYSE) as you know, makes toilet paper. And the Federal Reserve makes dollar bills. If I take a dollar bill and deposit it in my bank account, I’m lucky if I earn 0.5%. If I buy Kimberly Clark – it owns big printing presses that print toilet paper – I will earn a dividend yield of 4%, seven times higher.” …Russell Napier
The next five charts are courtesy Stockcharts.com
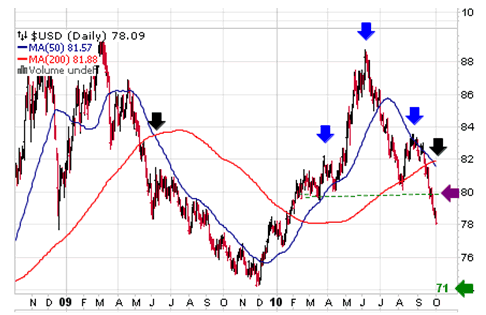
Featured is the US dollar Index. Price has fallen below the neckline in a ‘head and shoulders’ formation at the purple arrow. This pattern sets up a target at 71. The black arrow points to the fact that the 50DMA is moving into negative alignment with the 200D. When that happened in June 2009 the dollar fell for six months. Longer term the dollar has been in a downtrend since 2002 when it was ‘120’ on the index. When the dollar drops, everything expressed in dollars tends to rise, be it oil or gold.
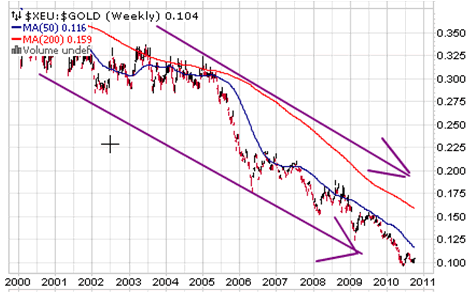
Featured is the Euro’s performance measured in terms of gold. While the Euro is declining, everything priced in Euros rises in price, including gold. Since July 2006 the European Union has forced the electronics industry to stop using certain products in assembly and production. Six products can no longer be used, including cadmium and lead. This has forced manufacturers to substitute gold and silver! This affects iPods, cell phones, computers and laptops. Analysts who rely strictly on ‘lines on a chart’ while disregarding fundamental changes in supply and demand, are going to make one mistake after another.
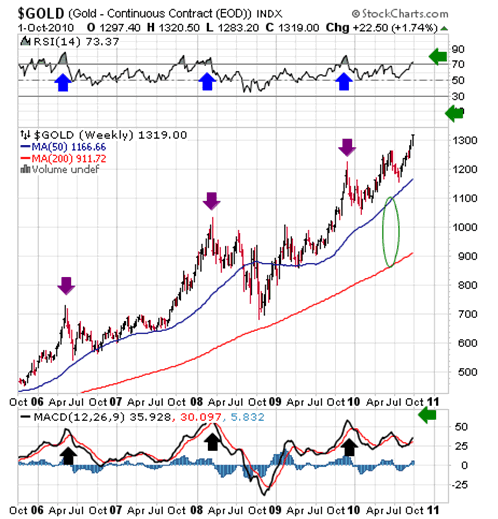
Featured is the weekly gold chart. This chart answers the question: Is gold overbought or does it have room to move higher? The green oval draws attention to the fact that the moving averages are in positive alignment and rising (sign of a bull market). The Blue arrows point to three occasions during the past five years when the RSI become overbought. The black arrows point to three occasions when the RSI became overbought. The purple arrows point to occasions when price became overbought, along with the supporting indicators (blue and black arrows). The green arrows point to current targets where, based on recent history, price will become overbought.
The editor of Munknee.com has compiled a list of analysts who have predicted higher gold prices. About 65 analysts are featured in the article. 65 out of a total of tens of thousands of analysts worldwide is a tiny minority. As time goes on this list will grow in number. The predictions range from $2,500.00 to $15,000.00 an ounce. (Yours truly has recommended gold since it was $35 an ounce and is on record in the article at $2,500.00 - $5,000.00)
Here is where a lot of analysts are making a big mistake!
Some analysts have forgotten about the unprecedented mountain of new money that has been created, and they have overlooked the impact of ETFs on mining stocks. If the dollars that have gone into ETFs were available to the mining sector, prices for gold miners would be multiples of what they are today. As it is now it will simply take a little longer for the uptrend to play out. Here are some examples of what can happen to gold and silver mining stocks:
• Mineral Resources 1975 at 0.60c to 1980 at 415.00
• Azure Resources 1975 at 0.05 to 1980 at 109.00
• Lion Mines 1975 at 0.07 to 1980 380.00
• Bankeno 1975 at 1.25, to 1980 at 430.00
• Steep Rock 1975 at 0.93 to 1980 at 440.00
Before this gold market reaches its peak there will be dozens of mining stocks with similar performances and the buying frenzy will equal that of the recent ‘dot-com’ activity.
Already the HUI index of gold and silver stocks is preparing to break out after having been in strong uptrend since the credit crunch of 2008-09 (see blue support line in the HUI chart below).
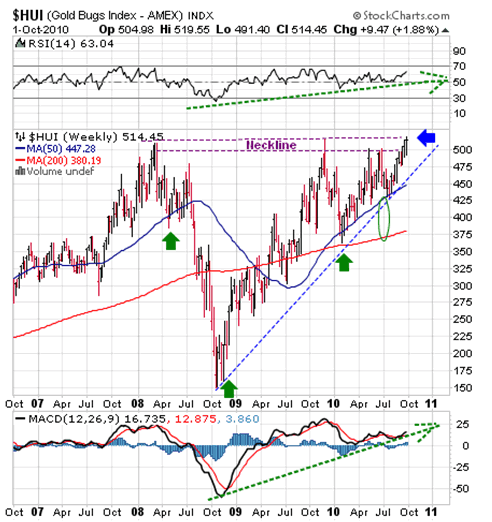
The pattern is a bullish ‘inverted head and shoulders’ formation (green arrows). A breakout at the blue arrow sets up a target at 850!
The RSI and MACD are positive. The 50 week moving average is in positive alignment to the 200 week moving average (green oval), and both are rising. While we do not know precisely when this breakout will occur, we do know that it could occur any day now, and when it does, another group of sceptical investors who have been on the sidelines will become buyers.
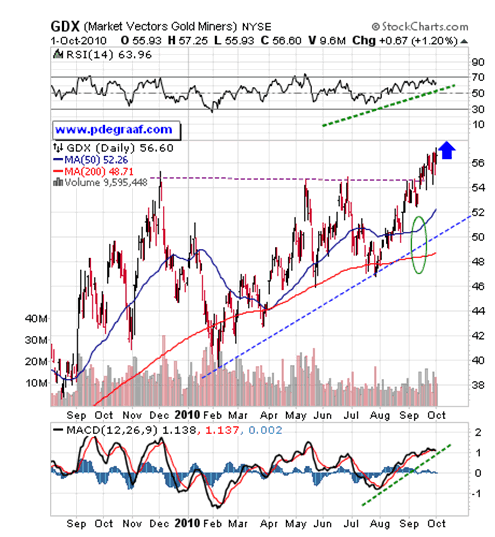
For the benefit of those of you who are sceptical that the HUI Index is going to accomplish an upside breakout we present the daily bar chart of the GDX, the gold stocks ETF. The upside breakout has already taken place here. The blue arrow points to a target at 73. Back in April the 50D ‘kissed’ the 200D. That was a very bullish omen!
Summary: The US government is impotent to solve the ongoing financial crisis. The 800 plus billion dollar bailout has not solved the unemployment problem (this is not a government function to begin with). What this money has done is further bloated the Federal Government with more employees and higher wages. It has also entrenched and rewarded a corrupt banking system, aided and rewarded by corrupt politicians such as Chris Dodd and Barney Frank.
The situation is further complicated by the uncertainty surrounding the implementation of ‘Obama-care’. It is difficult enough to grow your business without having to worry about the impact of this legislation, which was voted into law as House Speaker Nancy Pelosi said: “So we can see what is in it.” Talk about arrogance!
“We can’t solve problems by using the same kind of thinking we used when we created the problems.” …Dr. Albert Einstein.
The popular media is no longer doing its job: To quote Richard Salant, former president of CBS (1961 – 64 & 1966 -1979), “Our job is to give the public not what they want, but what we decide they ought to have.”
Meanwhile demand on government is growing daily as more and more people become unemployed or begin to collect food stamps. Morals are declining and people are walking away from ‘upside-down’ mortgages. What used to be a social taboo is now being bragged about.
“A people that values its privileges above its principles soon loses both.” President Dwight Eisenhower.
The aging US population causes higher government spending on a reduced tax base. Since 1971 (when the last tie to the discipline of gold was cut away), the Federal Reserve has come to the government’s rescue with printing press money. The only difference between then and now is the number of zero’s behind the dollar sign.
ALL OF THIS SPELLS HIGHER GOLD AND SILVER PRICES DOWN THE ROAD.
“In the distance, I see a frightful storm brewing in the form of un-tethered government debt. I choose the words –“frightful storm’ – deliberately to avoid hyperbole. Unless we take steps to deal with it, the long-term fiscal situation of the federal government will be unimaginably more devastating to our economic prosperity than the subprime debacle and the recent debauching of credit markets that we are working right now so hard to correct.” … Richard W. Fisher, (President and CEO of the Federal Reserve Bank of Dallas Texas).
Happy trading!
By Peter Degraaf
Peter Degraaf is an on-line stock trader with over 50 years of investing experience. He issues a weekend report on the markets for his many subscribers. For a sample issue send him an E-mail at itiswell@cogeco.net , or visit his website at www.pdegraaf.com where you will find many long-term charts, as well as an interesting collection of Worthwhile Quotes that make for fascinating reading.
© 2010 Copyright Peter Degraaf - All Rights Reserved
DISCLAIMER: Please do your own due diligence. I am NOT responsible for your trading decisions.
Peter Degraaf Archive |
© 2005-2022 http://www.MarketOracle.co.uk - The Market Oracle is a FREE Daily Financial Markets Analysis & Forecasting online publication.
Comments
|
TheCoinManHerb
16 Dec 10, 00:46 |
Silver
I live in the US and can see the storm brewing. I take all my US dollars and turn them into Silver Eagles. |