


British Pound Sterling GBP Currency Trend Forecast into Mid 2011
Currencies / British Pound Oct 04, 2010 - 12:10 AM GMTBy: Nadeem_Walayat

 Whilst many may perceive currency movements as wide multi-year trading ranges such as between highs of £/$ 2.00 to lows of £/$1.00, however all of the worlds currencies are actually in a continuous state of perpetual free fall where the multi-year high - low trading ranges are fluctuations within the differing rates of decent as all currencies are fiat backed by nothing more than mountains of ever expanding IOU's. The manifestation of the free fall in real values is the loss of purchasing power of currencies as measured by INFLATION that state propaganda has conditioned populations to accept as being a good thing.
Now some may dispute which if any of the official inflation indices is reliable, after all for the past 10 years successive UK Government's have pushed towards using the Consumer Price Index (CPI) to measure inflation with the new Coalition government accelerating the trend to replace the Retail Price Index (RPI) because the RPI measure tends to trend 1% to 2% above the CPI measure, i.e. current CPI is at 3.1% whilst RPI is at 4.7%, with the RPI itself another 1-2% below the real rate of UK inflation that is nearer to 6% as illustrated by the below annualised inflation graph which maps out the unfolding UK Inflation forecast trend for 2010 (27th December 2009 (UK CPI Inflation Forecast 2010, Imminent and Sustained Spike Above 3%). UK CPI Inflation at 3.1% for August 2010 is precisely inline with the forecast for where CPI inflation would be by August 2010.
The below CPI index graph better illustrates the loss of purchasing power, during the 13 year Labour Government which saw a loss of purchasing power on CPI of 28% and on RPI of 35%, which basically makes a mockery of statements that the Pound is either too strong, or that the Pound is too weak, as in actual fact all governments are debasing their currencies at a continuous rate with forex fluctuations reflecting the relative rate of free fall against one another.
Whilst the mainstream press tends to wholly focus on the relative rates of exchange at particular points in time as a measure of sterling's strength or weakness, which as the below graph implies is suggestive of a trading range for sterling over the past 25 years of between an approximate high of £/$2.00 and low of £/$1.37, with the current rate of £/$ $1.58 being near the middle of its trading range of £/$1.69, which therefore given the weight of press commentary gives people the false assumption that sterling is managing to hold up well against the worlds reserve currency.
However, the real purchasing power of the British Pound is better illustrated by the below graph which shows rather than sterling hovering towards the middle of a 25 year range, it has in fact continued to lose value virtually every year which has seen sterling's real value erode to stand at approximately 45% of the value that it was at in 1987.
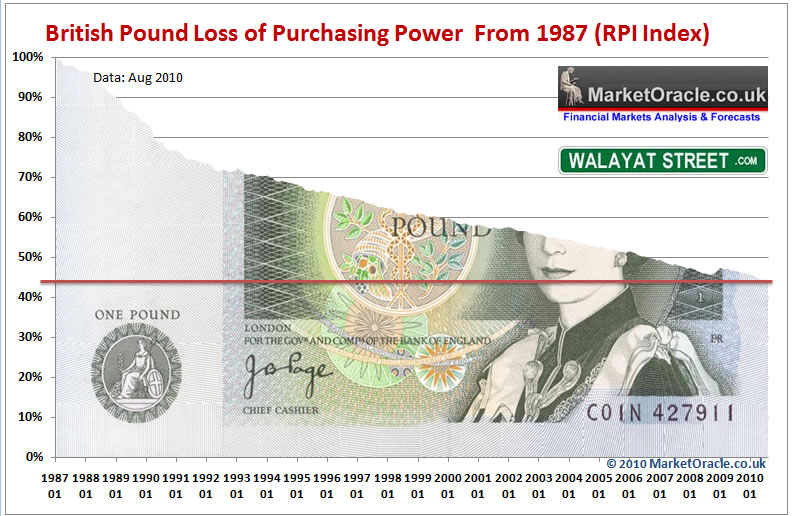
The above graph makes a mockery of all of the financial press as they give the various cross rates with commentary that sterling is strong or weak when in actual fact the inflation mega-trend ensures that there exists a stealth trend towards the erosion of the purchasing power of sterling so as to enable the government to run large deficits as well as stealth tax the loss of purchasing power by means of taxes on illusory interest returns and capital gains.
 The bottom line is that all fiat currencies are in free fall against one another that over the long run ensures that all currencies including the British Pound, U.S. Dollar, Euro, will gradually lose between 95% and 99% of their value over a 100 year time period, regardless of what trading ranges between currency pairs suggest. In other words £1 today will be roughly worth 1p in a 100 years time.
Deflation Delusion
The worlds government's require inflation to help finance their ever expanding size and scope which ensures that this Mega-Trend is not going to disappear in some delusional deflationary economic outcome, the reasons for which I have covered at length in the Inflation Mega-trend Ebook (FREE DOWNLOAD) as well as the following recent articles -
- 19 Sep 2010 - UK Government Stealth Debt Default Continues at Minimum Rate of 3% per Year
- 26 Aug 2010 - Deflation Delusion Continues as Economies Trend Towards High Inflation
- 15 Aug 2010 - Central Bankers Stoking the Inflation Fires, Whilst Academic Economists Worry about Deflation
- 13 Aug 2010 - The Real Reason for Bank of England's Worthless CPI Inflation Forecasts
- 05 May 2010 - Greece Economic Depression Resulting in INFLATION NOT DEFLATION Surge
The linked analysis basically concludes that there has been NO Deflation despite continuous stream of deflationary commentary form academic economists (paid sales men for the bankster fiat money printing system) that populate the mainstream press with much of their commentary and conclusions then further regurgitated by the BlogosFear.
Whilst my analysis is primarily focused on the UK economy, however Puru Saxena recently wrote an article on the US Economy that is pretty close to many aspects of my take on bogus UK deflation expectations (24 Sep 2010 - Deflation Reality or Urban Myth? ). The most notable item in the article is the graph on total commercial bank lending that is expanding (inflating) rather than contracting (deflating), so much for debt deleveraging deflation!
I am sure there are many more such examples of the illusion of debt deleveraging deflation especially where consumers are concerned given the highly artificial government supported U.S. housing market, which follows on from more than a year of debt deleveraging deflation mantra from pseudo economists that contribute towards the primary reason why over 90% of all traders lose which I touched upon recently (10 Sep 2010 - The Real Reason Why 90% of Traders Lose ).
The price paid by ordinary citizens for government policies of perpetual inflation and associated taxes is in the loss of purchasing power of earnings and savings, which occurs despite the continuous increase in worker productivity.
Currency Manipulation Wars
The problem in determining trends between currency pairs is further complicated because it is not only the relative loss of purchasing power through inflationary money printing and debt accumulation policies, but rather all governments to varying degrees (those that are not stuck in the Euro-zone such as the PIGS) seek to competitively devalue their currencies against one another so as to boost exports and reduce imports to improve or maintain their countries balance of trade and global trade induced economic activity which accelerates the rate of decent for all currencies than where they would be as floating currencies, which theoretically should seek to correct trade imbalances that governments instead fight against from occurring.
This manifests itself in an artificial managed currency market where instead of countries that run large trade deficits such as the US and UK seeing their currencies fall at a faster pace than countries that run large trade surpluses such as China and Japan, (Germany uses the bankrupting PIGS to its advantage so that they have to intervene LESS to keep the Euro weak).
The trade exporters intervene to manage their exchange rates from China's peg to the Dollar, to Japan stepping forward only the other week to spend hundreds of billions of Yen to buy Dollars in an attempt to cap the Yens rise to a 15 year high against the Dollar, which puts its export driven economic recovery at risk. Japan is coming under increasing pressure because China and other asian exporters such as South Korea are eating into Japans export markets, therefore this currency war is just as much Japan vs the rest of Asia than Japan vs USA. In response to Japans intervention other central banks also act to sell their currencies, to buy japanese yen and dollars, not because of a conspiracy of central bankster's, but because Japan sent a ripple through the currency markets as a consequence of weakening the Yen. In fact I would not be surprised if China is behind much of the Yen's recent rally (buying Japanese bonds) so that they can gain more exposure to the U.S. export market share by hurting Japan's exporters. Roughly both China and Japan hold an equal amount of U.S. Treasury bonds at about $830 billion each, so the currency war continues as they both seek to drive their respective currencies lower and the Dollar higher whilst other central banks are also forced to re-act or see their currencies appreciate.
However the impact of Japanese buying of dollars proved short lived because as mentioned earlier it is a case of all exporting countries fighting to keep their currencies weak against a FALLING U.S. Dollar and other importing currencies such as the sterling.
Some readers may at this point start to feel a little angry as to why the likes of Japan and China don't play fair by manipulating their currencies to keep them artificially weak instead of letting them float to correct unsustainable huge trade imbalances. Don't worry the system is designed so that the last laugh is on the currency pegging countries, for them to keep the pace of decline relative against fundamentally weak currencies such as the US Dollar or the British Pound then they need to BUY Dollars and British Pounds which usually means buying British and U.S. Government Bonds (paper IOU's). This allows countries to live far beyond their means as the people in the west basically live off of the hard work of poorly paid asian workers as the asian trade surpluses are recycled back into western debt. Debt that is constantly losing its value ! Off course there is a price to pay as the likes of the UK and USA find it difficult to compete and export and find it even more difficult to wean their populations off of cheap Chinese junk that fills up their nations garages, which therefore results in higher domestic unemployment and lower level of economic activity, whilst the Chinese enjoy relatively higher levels of employment and economic activity.
Some rogue politicians in the west calling for action against currency manipulators have not properly thought out the way the system works as they need to realise that what they are in effect asking for is for China to not only stop buying U.S. Treasury bonds but to sell them, and hence push up U.S. interest rates and at the same time send the U.S. dollar sharply lower and inflation sharply higher, though off course China is not going to stop buying US Dollars which is evident by the size of its $2.5 trillion reserves.
The policy of deficit importers such as the US and the UK has been to print money (via smoke and mirrors) to monetize debt with a flood of currency forcing their currencies lower thus prompting asian and other exporters to step into the currency markets in an attempt to soak up this perpetual new supply as well as fight against other exporters in an downward currency pegged death spiral that continuously seeks to inflate the west's debt bubbles by financing consumption and deficits. Since there is no sign of an end to the huge deficits especially for the U.S., therefore there is no sign of an end to quantitative easing to monetize the deficits. All of these competitive devaluations in the face of US money printing to monetize debt IS resulting in higher inflation as evidenced by the surge in commodity prices, and especially gold, which as expected is rising in all currencies that are spiraling downwards with one another as they fight a losing battle to peg themselves to death.
So the U.S. Fed is merrily pumping out dollars at 0.25% interest rate which prompts the banks and financial institutions to go across the world and chase higher returns with plenty of cheap dollars thus driving the dollar lower, against which other central banks are fighting hard to maintain their currency pegs and are thus forced to buy dollars which effectively means financing the U.S. budget deficit. It does not exactly match the case that the headline grabbing politicians make of evil foreign currency manipulators, does it ?
Also there is the question of U.S. dollar corporate and investment profits, all this flood of dollars invested into say China and other emerging markets would benefit hugely from a dollar devaluation, Chinese Yuan revaluation would mean higher dollar profits for U.S. corporations and financials. Which makes sense as the reason why U.S. politicians are so vocal on this subject as they tend to be on the payroll of Wall Street are thus pushing for a China Yuan revaluation so as to artificially create more dollar profits for Wall Street.
Furthermore countries such as the US and to a lesser degree the UK are obsessed with spending large chunks of their GDP on the military, so that they can keep butting in the on the internal affairs of other countries by operating a multitude of foreign military bases right across the globe, all of which means spending dollars for other currencies without any output i.e. one off consumption which explains why the trade deficits will persist no matter what crackpot protectionist trade tariff bill is enacted.
However, racking up ever more total debt whether monetized or not is not good, because there is an interest cost to pay on the debt which has an inflationary impact on the economy and results in an even further weakening of the currency that feeds the fires of inflation as the debt interest burden eats into government tax revenues leaving less available for spending which acts as a leverage to the amount of new currency printed which can only have spiraling inflationary consequences towards the ultimate destination of a hyperinflationary bust.
The new UK government is attempting to stabilise UK public sector debt as the recent analysis reaffirmed is expected to rise from about 65% of GDP and to stabilise at 72% of GDP as long as the UK government actually implements its severe spending cuts programme (29 Jun 2010 - UK ConLib Government to Use INFLATION Stealth Tax to Erode Value of Public Debt ).
But public debt of approx £850 billion is just the tip of the UK debt iceberg which is reflected by the total liabilities graph which whilst 18 months old is still implies that total PUBLIC liabilities on the UK economy stand at about £3.5 trillion at this time and no matter what the government does will continue to trend higher, and THEN on top of this we have private sector debt of some £5 trillion.
All of which goes towards determining the real downward pressure on sterling, but yet again all of the same pressures are baring down on all of the other currencies, for instance Japan IS bankrupt ! Public Debt is over 200% of GDP with even worse un-funded liabilities due to its exploding demographic time bomb i.e. growing ageing population and a shrinking workforce to support it.
Impact on Sterling
The impact on sterling of exporters fighting to keep their currencies weak against the dollar, euro and sterling is for sterling to rise because the UK governments priority is not to protect exports to the likes of China and Japan as the UK's key export markets are Europe and then the U.S. which account for more than 70% of UK exports against just 2.5% to China.
Dollar Reserve Currency Status
Not all currencies are equal which is illustrated by the fact that the U.S. can get away with far more in terms of debt and budget deficits than any other country on the planet by virtue of the fact that the U.S. Dollar is the worlds reserve currency, it is the primary means for exchange in the pricing and transacting of most of the worlds major commodities such as crude oil, which is the life blood of all economies. Therefore, US government's do not care if the dollar falls because they seek to rely on the fools in asia to prop up the dollar, which is why US interest rates could remain at 0.25% as long as the US economy remains weak, regardless of the rate of inflation (Current CPI 1.1%, though shadowstats says it is 8%).
The other benefit of a reserve currency is that during panics it is seen as a relative safe haven which results in a rush of investor panic buying. This by its nature can only be temporary as once the panic subsides then so should these funds wash out of the dollar. Over the summer of 2010, the Euro PIGS sovereign debt crisis saw this rush to the dollar safe haven, but given that nothing went pop over in Euro-land so virtually all of that safe haven buying has dissipated over the past 3 months. Therefore this does suggest that the forex markets will continue to be volatile as further shocks emanate out of the banking sector and bankrupting sovereigns, but the dollar safe haven buying 'should' again prove temporary, therefore future crisis will present opportunities to SHORT the dollar.
British Pound Currency Trend Analysis
British Pound Trend Forecast for 2010 - This analysis seeks to update the existing GBP trend forecast for 2010 (26 Dec 2009 - British Pound GBP Forecast 2010 Targets Drop to Below £/$1.40 ), that expected sterling to weaken against the U.S. Dollar to target a rate below £/$1.40 into the UK General Election on a break below the trigger level of £/$1.57 and thereafter to remain within this trading range for the next 6 months (into June 2010).
1. That sterling is targeting immediate support at £/$1.57 which implies it may temporarily bounce from there back through £/$1.60 before the eventual break. 2. That a break below £/$1.57 would target a trend to below £/$1.40. On a longer term view, the chart is indicative of trading range between £/$1.57 and £/$1.37, on anticipation of the eventual break of £/$1.57. On average this implies a 10% sterling deprecation against the trend of the preceding 6 months or so.
Which was further expanded upon in the January 2010 Inflation Mega-Trend Ebook to extend the trading range expectation into the end of 2010 as well as revising the 2010 floor to £/$1.40.
The implications of a USD trend towards 84, therefore implies that GBP is expected to break below the £/$ 1.57 trigger level over the next few weeks to enter a new trading range if between to £/$1.57 and £/$1.40 for most of 2010, with the initial expectation of a trend to below £/$1.50 towards the £/$1.40 floor as illustrated by the below graph for 2010 :
The below graph illustrates the actual trend that has subsequently transpired during 2010. The actual low came in at 142.50 shortly after the May General Election as the coalition government started to emerge from the hung parliament, which has resulted in a strong trend all the way back to break the upper end of the range.
The British Pound has shown relative strength against forecast expectations by putting in a slightly higher low at £/$1.4250 and trading above the upper end of the trading range, having put in a high of £/$1.60 during early August and subsequent low at £/$1.53 during early September. This relative strength on face value suggests that going forward GBP is more likely to break above £/$1.60 then below £/$1.53.
UK Budget Deficit Reduction - The U.S. has given no sign that it intends on reigning in the large budget deficit that stands at $1.5 trillion or 12% GDP, which is against the UK government that has announced concrete measures aimed at getting a serious grip on the budget deficit that it plans on reducing from £156 billion for 2009-10 to £20 billion by 2015-16. My earlier analysis (29 Jun 2010 - UK ConLib Government to Use INFLATION Stealth Tax to Erode Value of Public Debt ) concluded in the follow trend expectation for the UK budget deficit that expects the coalition government to maintain its deficit reduction target into 2012-13, after which I expect a divergence from the Coalition Government's plan as the government seeks to engineer an election boom going into May 2015.
Thus the UK aims to get a grip on its budget deficit whilst the U.S. is signaling that it could not careless and is prepared to run $1.5 trillion annual deficits all the way into 2020, which implies at least a doubling of the U.S. national debt. The deficits trend expectations is therefore strongly positive for sterling against a weakening dollar as the forex markets act in advance of expanding and contracting deficits which is the relative opposite trend paths for the UK and US.
U.S. Dollar Meltdown
GBP has traded up towards the top of its 2010 trading range, to judge if this is indicative of sterling strength due to new government deficit reduction measures or dollar weakness, we need to take a look at the USD index which basically comprises 60% Euro against 12% GBP.
The U.S. Dollar bull market trend started to evaporate following the early June peak just shy of USD 90. Quick analysis points to major support in the zone USD 74-77 against the last close of USD78, which suggests that the immediate phase of the dollars downtrend should be coming to an end and suggestive of a bounce back towards USD 80, the implications for sterling are that there should be a pause in its uptrend, therefore a break above £/$1.60 does not look imminent. However the USD trend is clearly bearish and confirms my earlier suspicions that the US Fed has decided to let the dollar burn so as to punish the currency manipulators, therefore any dollar bounce should be temporary therefore GBP as is the case for most currencies is expected to rally against the Dollar.
Euro / Sterling
The mainstream press populated by academic economists for the past 6 months has been obsessed with headline grabbing stories of an always imminent collapse of the Euro, even today Joseph Stiglitz writes in the Telegraph -
Turning to the euro, Mr Stiglitz said that the different needs of countries with high trade surpluses, particularly Germany, and those running deficit such as Ireland, Portugal and Greece, meant that the single currency was under intense pressure and may not survive.
However contrary to a currency that is on the verge of collapse, the USD trend (60% Euro) and the above Euro / Sterling chart do not show a currency on the edge of the abyss, far from it. Euro / Sterling is little changed from the start of the year with the longer run trend picture of a corrective sideways trading range for sterling with an upward bias. The most recent decline in Euro / Sterling to the support level confirms the above USD analysis that the Euro is expected to weaken in the immediate future, therefore suggesting dollar and sterling strength. With GBP strength usually occurring in sympathy to Euro strength against the dollar which suggests a weakening of GBP. However the longer term picture is for sterling's shallow up sloping trend to continue that targets Euro / Sterling of 1.30 (current 1.15), which if the dollar downtrend persists implies a far stronger GBP rate 6 months from now, i.e. well north of the mid-way point of £/$1.69.
Gold Homes in on $1333 Target, What about Sterling Gold?
The dollars meltdown is further illustrated by the Gold price blasted through $1300 resistance to close at £1319 on Friday with most other commodities either leading or lagging Gold's bull run such as crude oil soaring during the week to close up more than 7% at $81.61.
The strong drive higher to $1319 now puts gold within touching distance of the forecast minimum Gold target for 2010 of $1333 as per the January 2010 Inflation Mega-trend Ebook (FREE DOWNLOAD) and subsequent posting (Gold Analysis and Price Trend Forecast For 2010 )
Gold Price Forecast Conclusion
The two key conclusions are:
1. That the current correction is targeting $1050 to be achieved during February 2010
2. That Gold is targeting an Impulse Wave 5 into late 2010 peak of at least $1333 which remains as per the original forecast of 1st November 2009.
Both the Dollar forecast and the seasonal trend are supportive of the view for Gold price relative weakness into July / August 2010, following which the Gold price is expected to break out to a new high. This suggests that Gold may trend sideways for the first half of 2010 into July / August as the following graph concludes:
Charts courtesy of StockCharts.com
Gold Beyond $1333
As mentioned earlier, $1333 is just a target for 2010, the Gold price may even reach as high as $1,400 this year, enroute towards my longer-term target of $2,000 which would basically represent a 85% gain on the current price of $1081 and much more so when Gold stocks are brought into the equation though there trends are also subject to that of the general stock market.
The Gold trend now demands an in-depth analysis to update the prospects for the Gold price into 2011, however a quick analysis of trend shows gold short-term overbought (MACD) but little signs for an imminent major reversal and given that 3 months remain for 2010, gold $1400 is achievable during 2010, and where gold goes silver follows with the final speculative spurts nearly always being LEVERAGED to the gold price trend (for more on Silver's 2010 trend see the FREE Inflation Mega-Trend Ebook).
Whilst the gold priced in dollars has soared to new highs over the past month, unfortunately for investors in most other currencies including sterling the picture is that of a little more conservative recent trend that has yet to make a new 2010 high as the below graph illustrates:
Gold's recent sterling uptrend does not look particularly strong when compared against the preceding run up to the May high. At best it suggests Gold will take some time to break above its highs, though the risk is more for gold rolling over and targeting a break of the late July lows, which paints a picture of sterling strength against the dollar even on a short-term horizon.
UK Economic Growth - The UK economy continues to surpass academic economist expectations, with actual trend so far precisely inline with my forecast of December 2009 (31 Dec 2009 - UK Economy GDP Growth Forecast 2010 and 2011, The Stealth Election Boom) that continues to target a strong economic recovery for 2010 of GDP +2.8%, which should continue to result in sterling relative strength against dollar as the US economy continues to stutter and splutter along. My updated analysis following the coalition budget (09 Aug 2010 - UK Economy GDP Growth Forecast 2010 to 2015 ) maps out a growth trend into 2015 is illustrated below -
Soon to be implemented austerity measures will bite into UK economic activity during 2011, which suggests sterling strength into early 2011 followed by weakness in trend following weaker economic data during mid 2011, but no double dip recession so more suggestive of trading range behaviour.
GBP TECHNICAL ANALYSIS
ELLIOTT WAVE THEORY- The EWT pattern implies that GBP is in Impulse wave 3, which projects to £/$1.82.
TIME ANALYSIS - The last GBP bull market ran for 6.5 years, the current bull market is approaching its 2nd anniversary by the start of 2011. Other bull markets have typically also ran for between 6-7 years. However usually there is greater level of trend volatility than observed during the last bull market.
TREND ANALYSIS- GBP made a recent high just shy of £/$1.60 resulting in reaction low of £/$1.5250. The most recent rally again targets £/$1.60, however there exists a strong resistance above £/$1.60 which suggests that even if GBP breaks above the last high, it is unlikely to power ahead as it did following the £/$1.42 low, instead more probable is for a further period of consolidation therefore suggestive of a wider trading range of between £/$1.63 and £/$ 1.53.
SUPPORT / RESISTANCE- Immediate resistance is at £/$1.60, then £/$1.70, then £/$1.93. Support is at £/$1.53 then £/$1.50. Which suggests a volatile trend to £/$1.70 a break of which targets £/$1.90.
MOVING AVERAGES - The 200 week moving average is at £/$1.75 which falls to £/$1.70 by early 2011. The 200day moving average is at £/$1.54, which confirms the current bullish trend and support below £/$1.55.
PRICE TARGETS - Upside price targets resolve towards £/$1.70 and £/$1.90. Downside price targets resolve towards £/$1.53.
MACD - Weekly MACD is neutral which is supportive of the view of a shallower uptrend than that which occurred off of the £/$142.50 low. Daily MACD implies an upward trend is now underway that suggests £/$1.60 should break. Combined MACD suggests that GBP should continue trending higher to £/$1.70 before correcting.
SEASONAL TREND- Seasonal analysis suggests GBP should trend sideways into year end from now. Which is supportive of the view of a shallow uptrend to £/$1.70 ahead of Q1 2011 correction before sterling spurts higher to £/$1.90.
BRITISH POUND CONCLUSION
The people of Britain should count themselves lucky to have a government that gives all of the signs that it in tends on getting a grip of the budget deficit, though contrary to the politicians statements the government will NOT be able to prevent total debt from increasing by 50% over the next 5 years, which suggests that most of the politicians do not understand Britain's debt situation as they confuse deficit reduction with debt reduction. Nevertheless the positive outcome is for a lower pace of decline for sterling than the dollar (the U.S. is busy printing money to finance a military it cannot afford) which therefore implies a higher UK GBP rate as long as the proposed cuts and deficit reduction materialises, which according to my own analysis suggests that the government should be able to do so for at least the next 2 years, so in currency trends terms this is bullish for sterling for at least the next 1-2 years against the U.S. Dollar, which is set against the US authorities showing NO signs of restraint in terms of getting a grip of the deficit instead the opposite is true.
In terms of the GBP trend, the UK appears to have entered into the goldilocks zone (comparatively speaking) i.e. deficit reduction without triggering a double dip recession, a trend that looks set to continue for at least a year. The big question mark is how will the US economy perform relatively speaking, all the signs are for the US economy to continue to underperform the UK for the next 12 months which confirms a bullish GBP trend.
GBP Final Forecast Conclusion
The British Pound is in a multi-year bull market against the U.S. Dollar, I expect the current phase of this bull market to see GBP trend higher into mid 2011 targeting a rate of between £/$ 1.80 and £/$1.90 as the below forecast trend graph illustrates (current £/$ 1.58), though I would not be surprised if GBP trades above £/$1.90. I also expect sterling to strengthen against the Euro that targets a trend high E/£ 1.30 (current E/£1.15). However the forex markets will be just as volatile as they have been during the past 2 years as future sovereign debt and banking sector crisis will temporarily result in a surge of safe haven dollar buying, which will present future opportunities to short the dollar.
The GBP forecast conclusion will now be applied to my next in-depth analysis on UK interest rates, and then USD, ensure you are subscribed to my always free newsletter to get these in your email in box.
Stocks Stealth Bull Market Strongest September for 70 Years
The stock market rallied during september right from the start of the month without any significant reactions against a solid uptrend that saw the Dow close at 10,788 (up 7.7%) which is contrary to the mainstream press and the BlogosFear mantra of first having pumped investors full of hindenberg crash omen fears during much of August, which then continued to scream Fear in a near relentless mantra for the whole of September by dredging up historic precedents that September is usually one of the worst months for stocks and therefore investors should seek to sell ahead of an anticipated slump or that NEVER materialised.
The Dow during September continued the trend in line with my last quick analysis of (29 Aug 2010 - UK Economy Booms Whilst U.S. Stutters, Stocks Fail to Follow Crash Script ) that concluded in an anticipated break of the downtrend channel that the Dow had been in at the time, with the primary buy trigger at 10,200 to target the top of its trading range of 10,700 with probability favouring a break higher. With further interim analysis during the month confirming this view (05 Sep 2010 - Inflation Mega-Trend Long-term Growth Spiral Continues to Drive Stock Market Trend )
Bottom Line - Nothing new to report short-term the Dow remains in a corrective trading range of approx 10,700 to 10,000. Everybody tells you that September is usually one of the the worst months for stocks. I say its in a range with probability favouring a break higher.
The Dow has remained in its corrective trading range that has continued to work off the preceding 13 months bull run, 5 months so far, with my last in depth analysis (16th May 2010 - Stocks Bull Market Hits Eurozone Debt Crisis Brick Wall, Forecast Into July 2010 ) concluding that the corrective sideways trend could extend all the way into early October, with the subsequent price action pretty much following the script. The more time the stock market spends within its corrective trading range the more powerful will be the eventual breakout, then those waiting for corrections to enter will be waiting all the way to Dow 12,000+!
My next in depth analysis remains pending, however my original expectations remain for the Dow to target 12,000 to 12,500 by year end as illustrated by the below graph from the Inflation Mega-Trend Ebook (FREE DOWNLOAD). The longer term trend remains as I voiced right at the very bottom in March 2009 (15 Mar 2009 - Stealth Bull Market Follows Stocks Bear Market Bottom at Dow 6,470), is for the stock market to have entered into a multi-year bull market, so far the market has done NOTHING to negate this scenario.
Meanwhile bear market rally mantra continues.... I warned investors of what to expect 18 months ago in early April 2009 (05 Apr 2009 - Stocks Stealth Bull Market Closes above Dow 8,000), so I am not surprised that the bear market mantra still persists to this day and will continue to do so all the way to new bull market highs.
STILL a Bear market Rally ? , Will it Always Be a Bear Market Rally ?
There was a time when the consensus was that a 20% rally would turn a bear market into a bull market. The rally to date is 24% but apparently it is STILL a bear market rally, and when the market is up 40%, what then? It WILL STILL BE termed as a bear market rally ! Which is by DEFINITION what one EXPECTS of a A STEALTH BULL MARKET! To TRADE, To INVEST, One NEEDs a Decisive CONCLUSION, not that it could be this or that or the other, but IT IS until the price tells you otherwise. We ARE IN a STOCKS BULL MARKET THAT BOTTOMED AT DOW 6470!, The MARKET HAS DONE NOTHING OTHER THAN SUPPORT THIS TRADEABLE CONCLUSION!
An in-depth update and forecast for the Dow into the end of 2010 will follow current scheduled analysis. To receive these in your email in box ensure you are subscribed to my ALWAYS FREE Newsletter.
Comments and Source : http://www.marketoracle.co.uk/Article23203.html
By Nadeem Walayat
Copyright © 2005-10 Marketoracle.co.uk (Market Oracle Ltd). All rights reserved.
 Nadeem Walayat has over 24 years experience of trading derivatives, portfolio management and analysing the financial markets, including one of few who both anticipated and Beat the 1987 Crash. Nadeem's forward looking analysis specialises on UK inflation, economy, interest rates and the housing market and he is the author of the NEW Inflation Mega-Trend ebook that can be downloaded for Free. Nadeem is the Editor of The Market Oracle, a FREE Daily Financial Markets Analysis & Forecasting online publication. We present in-depth analysis from over 600 experienced analysts on a range of views of the probable direction of the financial markets. Thus enabling our readers to arrive at an informed opinion on future market direction. http://www.marketoracle.co.uk
Disclaimer: The above is a matter of opinion provided for general information purposes only and is not intended as investment advice. Information and analysis above are derived from sources and utilising methods believed to be reliable, but we cannot accept responsibility for any trading losses you may incur as a result of this analysis. Individuals should consult with their personal financial advisors before engaging in any trading activities.
Nadeem Walayat Archive |
© 2005-2022 http://www.MarketOracle.co.uk - The Market Oracle is a FREE Daily Financial Markets Analysis & Forecasting online publication.