


Market Report on SP500, Crude Oil, Gold and U.S. Dollar
Stock-Markets / Financial Markets 2010 Sep 30, 2010 - 06:23 AM GMTBy: Chris_Vermeulen

 Wednesday the market didn’t tell us anything new. The equities market is still over extended on the daily chart but the market is refusing to break down. Each time there has been seen selling in the market over the past two weeks, the market recovers. Equities and the dollar have been trading with an inverse relationship and it seems to drop every in value each selling pressure enters the market, which naturally lifts stocks.
That being said, sellers are starting to come into the market at these elevated levels and it’s just a matter of time before we see a healthy pullback/correction. The past 10 session volatility has been creeping up as equities try to sell off. There will be a point when a falling dollar is not bullish for stocks but until then it looks like printing of money will continue devaluing of the dollar to help lift the stock market. Some type of pullback is needed if this trend is to continue and the markets can only be held up for so long.
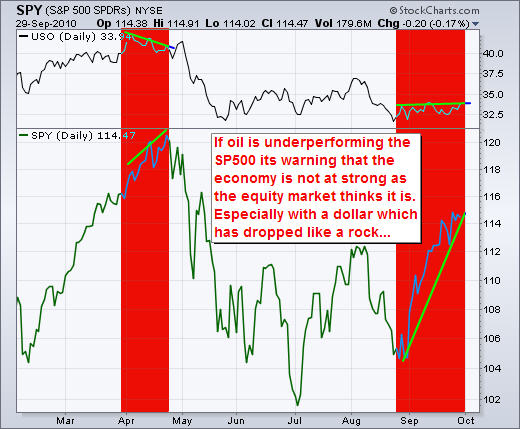
Below is a chart of the USO oil fund and the SPY index fund. Crude has a tendency to provide an early warning sign for the strength of the economy. As you can see from the April top, oil started to decline well before the equities market did. This indicated a slow down was coming.
The recent equities rally which started in late August has been strong. But take a look at the price of oil. It has traded very flat during that time indicating the economy has not really picked up, nor does it indicate any growth in the coming months. This rally just may be coming to an end shortly.
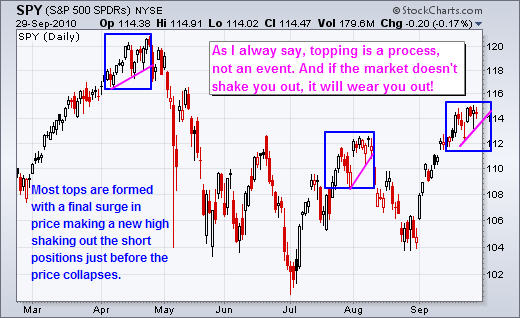
This daily chart of the SP500 fund shows similar topping patterns. This looks to be the last straw for the SP500. Most tops occur with a gap higher or early morning rally reaching new highs, only to see a sharp sell off by the end of the session which generates a reversal day. From the looks of this chart that could happen any day.
In short, volume overall in the market remains light which is why we continue to see higher prices. Light volume typically gives the stock market a positive bias while Sell offs require strong volume to move lower. That being said every dip in the equities market which has been close to a breakdown seems to get lifted back up by a falling dollar, but that can only happen for so long because one the volume steps back into the market the masses will be in control again.
You can get my ETF and Commodity Trading Signals if you become a subscriber of my newsletter. These free reports will continue to come on a weekly basis; however, instead of covering 3-5 investments at a time, I’ll be covering only 1. Newsletter subscribers will be getting more analysis that’s actionable. I’ve also decided to add video analysis as it allows me to get more info across to you quicker and is more educational, and I’ll be covering more of the market to include currencies, bonds and sectors. Before everyone’s emails were answered personally, but now my focus is on building a strong group of traders and they will receive direct personal responses regarding trade ideas and analysis going forward. Due to more analysis and that I want to keep the service personal the price of the service will be going up Oct 1st, so join today.
Let the volatility and volume return!
If you would like to receive my Trading Analysis and Signals Complete with Entry, Targets and Protective Stops please visit my website at: www.TheGoldAndOilGuy.com
By Chris Vermeulen
Chris@TheGoldAndOilGuy.com
Please visit my website for more information. http://www.TheGoldAndOilGuy.com
Chris Vermeulen is Founder of the popular trading site TheGoldAndOilGuy.com. There he shares his highly successful, low-risk trading method. For 6 years Chris has been a leader in teaching others to skillfully trade in gold, oil, and silver in both bull and bear markets. Subscribers to his service depend on Chris' uniquely consistent investment opportunities that carry exceptionally low risk and high return.
This article is intended solely for information purposes. The opinions are those of the author only. Please conduct further research and consult your financial advisor before making any investment/trading decision. No responsibility can be accepted for losses that may result as a consequence of trading on the basis of this analysis.
Chris Vermeulen Archive |
© 2005-2022 http://www.MarketOracle.co.uk - The Market Oracle is a FREE Daily Financial Markets Analysis & Forecasting online publication.