The Seven Plus Year Super Cycle Recession In US Auto Sales Continues
Economics / US Auto's Oct 01, 2007 - 12:52 AM GMTBy: Bob_Bronson

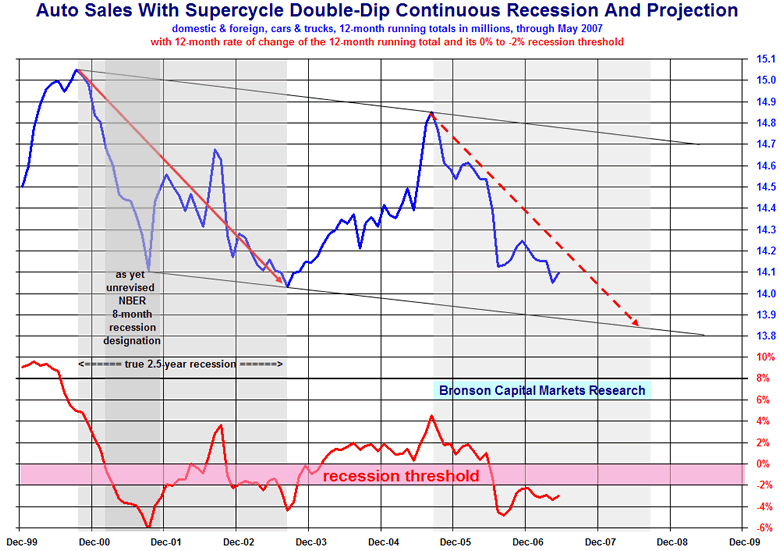
 Auto sales have been in a continuous recession for the past seven years. They never fully recovered from the last recession, and thus never entered an expansion stage, and they have been declining sharply for the past 22 months since their Jul '05 peak (on a rolling 12-month cumulative basis).
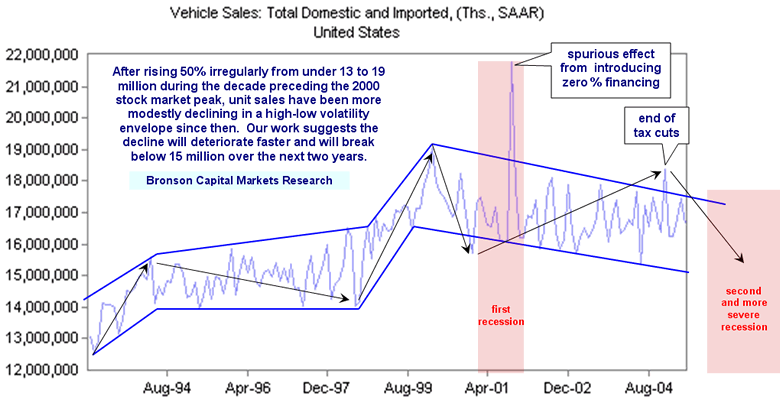
The first chart below updates our projection from 25 months ago (second chart below).


The auto manufacturers obviously see further trouble ahead since GM and Ford began offering aggressive incentives late last month, with zero-percent financing for 36 months on some models to go along with additional cash-back deals. Toyota and Honda are offering higher discounts than last year, as marketplace competition heats up.
The path of their seven-year decline is a Supercycle ABC zigzag (down-up-down) pattern consistent with the associated mania and echo-mania in the stock market. Since cars and trucks are the most expensive durable goods for consumers, they are their biggest discretionary purchase. So naturally, they lead and verify the Supercycle Bear Market ABC pattern for the stock market that we have been repeatedly pointing out in different ways: http://www.financialsense.com/editorials/bronson/main.html
The Supercycle ABC pattern is also economically confirmed by growth in GDP, and especially in the fixed investment portion of the GDP/NIPA, where business capital spending and housing (especially sales prices) are in actual decline. The ABC pattern also is revealed in employment and the growth rate of business profits, all of which we have reported in previous reports.
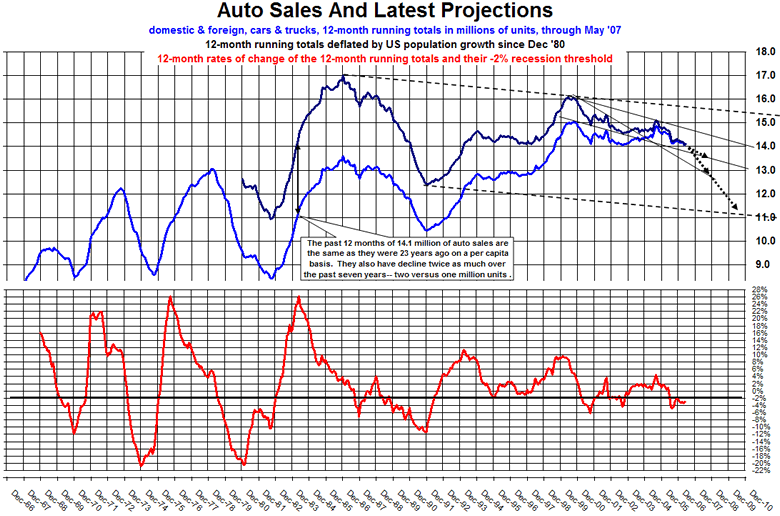
The third chart below shows the past 40 years of auto (unit) sales, adjusted for population growth since Dec 1980. Notice the past 12 months auto sales of 14.1 million units are at the same level as they were 23 years ago. Unit sales are a more reliable measure of real, or inflation-adjusted, auto sales since deflating nominal dollar sales with auto-specific price inflation, including various types of discounts and hedonic (quality) adjustments, is very problematic.

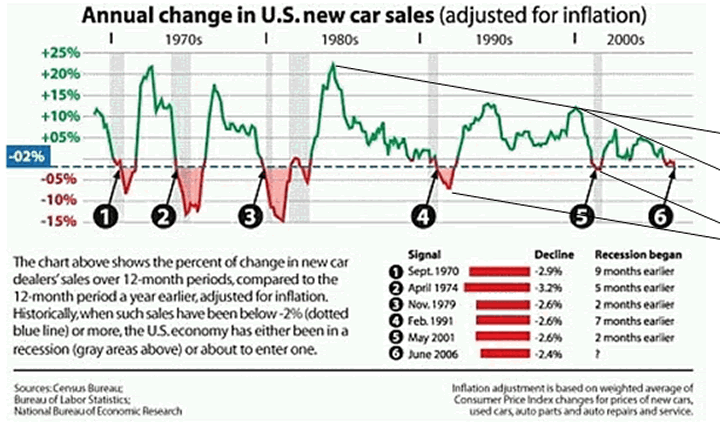
The fourth chart below illustrates how the minus 2% threshold in annual growth rate of real dollar auto sales has been a good signal for recession in the overall economy. Essentially the same threshold is confirmed by our first chart (above) of unit auto sales.

When BEA reports the June data for trucks next week, we will send you (to receive them join our private e-mail list by clicking the link below) the first and third charts updated for the auto and truck data, but it certainly won't show any improvement in the accelerating deterioration of the very predictable more severe second recession during the ongoing Supercycle Bear Market Period.
By Bob Bronson
Bronson Capital Markets Research
bob@bronsons.com
Copyright © 2007 Bob Bronson. All Rights Reserved
Bob Bronson 's 40-year career in the financial services industry has spanned investment research, portfolio management, financial planning, due diligence, syndication, and consulting. At age 23, he and his partner founded an investment research firm for institutional clients and were among the first to use mainframe computers for investment research, especially in the areas of alpha-beta analysis and risk-adjusted relative strength stock selection. Since 1967, he has served as an investment strategist and consultant to various investment advisory firms and is the principal of Bronson Capital Markets Research. If you wish to read more, read his BIO
A note to visitors ~ We do not have a website, but we maintain a private e-mail list. I'm also often asked why we provide research and forecast information for free. Since we are not looking for new business from the internet, I periodically post some of our research and forecasts in exchange for feedback from others. And since we don't publish in academic or industry trade journals, such internet discussion gives us as much peer review as we want and can conveniently assimilate at this time.
Also, the few archiving discussion boards in which I have the time to participate give us new ideas and allow us to establish and maintain intellectual property copyrights for our proprietary research, and to establish a verifiable forecasting record. At the same time, we are able to publicly document our forecasts and help others who otherwise don't have access to our work.
To be added to our private e-mail list, we only ask that you periodically provide feedback: questions, comments and/or constructive criticism to keep our research work and forecasts as error-free, readily comprehensible and topically relevant as possible. If you would like to be added, please explain, at least briefly, what you do, since our e-mailing list is categorized by the backgrounds of the recipients.
Robert E. Bronson, III Archive |
© 2005-2022 http://www.MarketOracle.co.uk - The Market Oracle is a FREE Daily Financial Markets Analysis & Forecasting online publication.


