U.S. Unemployment Rate Could be Higher in September vs. August
Economics / US Economy Sep 29, 2010 - 02:46 AM GMTBy: Asha_Bangalore
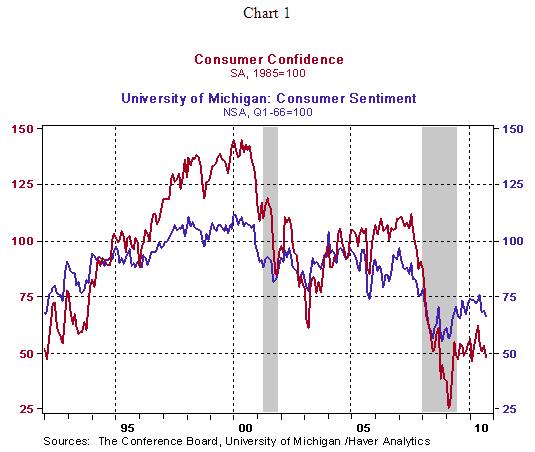
 The Conference Board's Consumer Confidence Index slipped to 48.5 in September from 53.2 in August. The September reading is the lowest since February 2010 (46.4). The historical low is 25.3, registered in February 2009. The University of Michigan Consumer Sentiment index also declined in September (66.6 vs. 68.9 in August). The decline in consumer outlook appears to be tied to the prevailing conditions in the job market. Although the recent recession officially ended in June 2009 and real GDP has posted growth for four straight quarters, the 9.6% unemployment rate in August is an elevated level playing an important role in the pessimistic outlook of consumers.

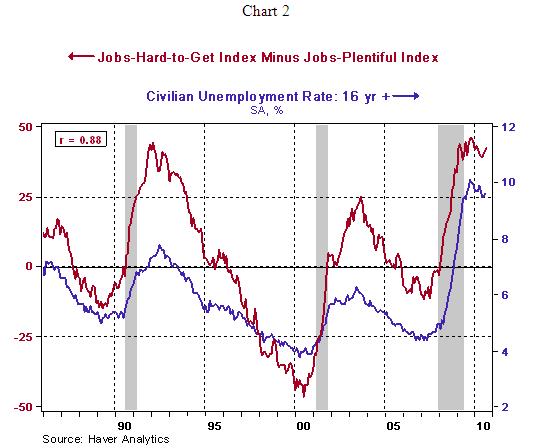
The Conference Board's survey results show that the number of respondents indicating "jobs are hard to get" moved up to 46.1% in September vs. 45.5% in the prior month. At the same time, the number responding that "jobs are plentiful" inched down to 3.8% from 4.0% in August. The net of these two indexes has a positive correlation with the unemployment rate (see chart 2). The larger net difference between the two indexes in September (42.3 vs. 41.5 in August) suggest a higher jobless rate in September.

Large Number of Unsold Homes in Marketplace Will Continue to Trim House Price Gains
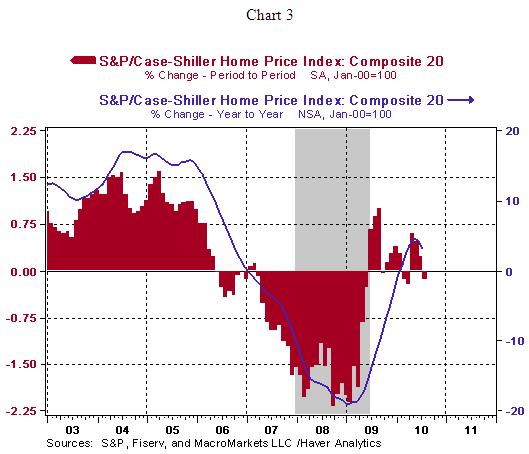
The seasonally adjusted Case-Shiller Home Price Index of 20 metro areas fell 0.1% in July (see chart 3) after posting gains in each of the three months of the second quarter. On a year-to-year basis, the not seasonally adjusted Case-Shiller Price Index increased 3.2%, the smallest increase in the last four months. What conclusions can be drawn from these numbers? Home prices continue to show a positive trend on a year-to-year basis, albeit a smaller gain during July compared with readings of the second quarter. Last week's inventories data of unsold new and existing homes point to continued downward pressure on prices, particularly given the fact that foreclosures make up roughly a third of existing home sales.

Asha Bangalore — Senior Vice President and Economist
http://www.northerntrust.com
Asha Bangalore is Vice President and Economist at The Northern Trust Company, Chicago. Prior to joining the bank in 1994, she was Consultant to savings and loan institutions and commercial banks at Financial & Economic Strategies Corporation, Chicago.
The opinions expressed herein are those of the author and do not necessarily represent the views of The Northern Trust Company. The Northern Trust Company does not warrant the accuracy or completeness of information contained herein, such information is subject to change and is not intended to influence your investment decisions.
© 2005-2022 http://www.MarketOracle.co.uk - The Market Oracle is a FREE Daily Financial Markets Analysis & Forecasting online publication.


