Cisco Breaking Out?
Companies / Company Chart Analysis Sep 27, 2010 - 01:30 PM GMTBy: Mike_Paulenoff
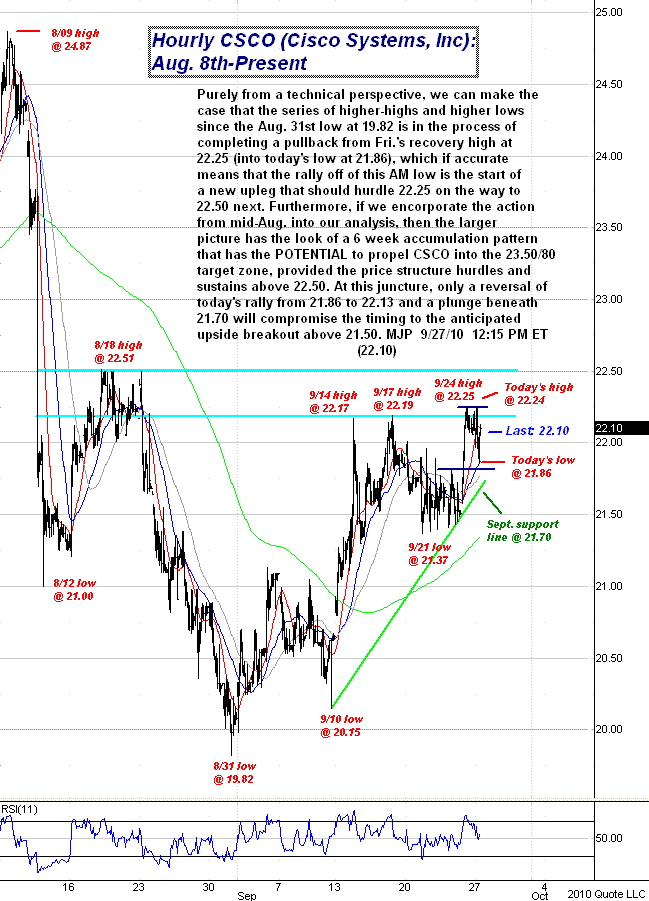
Purely from a technical perspective, we can make the case that with the series of higher-highs and higher lows since the August 31 low at 19.82, Cisco (CSCO) is in the process of completing a pullback from Friday's recovery high at 22.25 (into today's low at 21.86). If accurate that means that the rally off of this morning's low is the start of a new upleg that should hurdle 22.25 on the way to 22.50 next.
Furthermore, if we incorporate the action from mid-August into our analysis, then the larger picture has the look of a 6 week accumulation pattern that has the potential to propel CSCO into the 23.50/80 target zone, provided the price structure hurdles and sustains above 22.50. At this juncture, only a reversal of today's rally from 21.86 to 22.13 and a plunge beneath 21.70 will compromise the timing to the anticipated upside breakout above 21.50. MJP 9/27/10 12:15 PM ET (22.10)

Sign up for a free 15-day trial to Mike's ETF & Stock Trading Diary today.
By Mike Paulenoff
Mike Paulenoff is author of MPTrader.com (www.mptrader.com), a real-time diary of his technical analysis and trading alerts on ETFs covering metals, energy, equity indices, currencies, Treasuries, and specific industries and international regions.
© 2002-2010 MPTrader.com, an AdviceTrade publication. All rights reserved. Any publication, distribution, retransmission or reproduction of information or data contained on this Web site without written consent from MPTrader is prohibited. See our disclaimer.
Mike Paulenoff Archive |
© 2005-2022 http://www.MarketOracle.co.uk - The Market Oracle is a FREE Daily Financial Markets Analysis & Forecasting online publication.


