The Real Economic Cost of Government Is Spending, So What Do You Want to Cut?
Economics / Government Spending Sep 23, 2010 - 03:15 PM GMTBy: Paul_L_Kasriel
One of the biggest issues in this mid-term election is the desire to pare the rate of growth in federal government spending. Economically speaking, this is spot on because the real economic cost of government is how much it spends. Bear in mind, the federal government always gets the funds it needs to pay for its expenditures - through taxation, borrowing and/or "printing." The more the federal government spends, the more productive resources it directs, leaving fewer resources at the disposal of the private sector.
Because the private sector generally uses productive resources more efficiently because of competitive pressures than does the federal government, the economy's long-run potential real economic growth rate is adversely affected by increases in federal government spending.
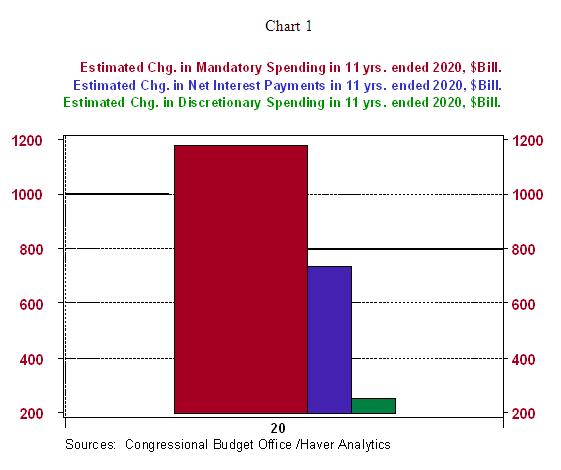
So, by all means, in the interest of promoting a higher rate of long-term U.S. real economic growth, let's slow down the projected increase in federal government spending. Where do you want to start? The chart below shows the CBO's projections of increases in various categories of federal government outlays over the 11 years ended 2020. As the chart shows, the largest projected increase in spending by an order of magnitude over these years is for mandatory or entitlement programs - Social Security, Medicare and Medicaid. Demographics is the primary factor driving up these entitlement expenditures. Millions of baby boomers will become eligible for Social Security and Medicare benefits during the period covered in these projections.
The second largest projected increase in federal expenditures is interest on the debt. On a percentage basis, this is the fastest growing category of federal outlays. Why is interest on the public debt growing so rapidly over this period? Partly because of the interest on all of the public debt piled up as a result of the federal budget deficits being incurred in each of the past fiscal years starting in 2002. That relatively small (green) bar in the chart represents the projected increase in all other federal outlays besides entitlement programs and interest on the public debt. The upshot of all this is that if one is serious about slowing the rate of increase in federal government outlays in the "out years," reduce entitlements for baby boomers. Good luck with all that.

Paul Kasriel is the recipient of the 2006 Lawrence R. Klein Award for Blue Chip Forecasting Accuracy
by Paul Kasriel
The Northern Trust Company
Economic Research Department - Daily Global Commentary
Copyright © 2010 Paul Kasriel
Paul joined the economic research unit of The Northern Trust Company in 1986 as Vice President and Economist, being named Senior Vice President and Director of Economic Research in 2000. His economic and interest rate forecasts are used both internally and by clients. The accuracy of the Economic Research Department's forecasts has consistently been highly-ranked in the Blue Chip survey of about 50 forecasters over the years. To that point, Paul received the prestigious 2006 Lawrence R. Klein Award for having the most accurate economic forecast among the Blue Chip survey participants for the years 2002 through 2005.
The opinions expressed herein are those of the author and do not necessarily represent the views of The Northern Trust Company. The Northern Trust Company does not warrant the accuracy or completeness of information contained herein, such information is subject to change and is not intended to influence your investment decisions.
Paul L. Kasriel Archive |
© 2005-2022 http://www.MarketOracle.co.uk - The Market Oracle is a FREE Daily Financial Markets Analysis & Forecasting online publication.


