


Stock Market SP500 Options Expiry Overnight Shakeout, What’s Next?
Stock-Markets / Stock Markets 2010 Sep 20, 2010 - 03:09 AM GMTBy: Chris_Vermeulen

 I think it’s safe to say that everyone knows the markets are manipulated... but during options expiry week we tend to see prices move beyond key resistance and support levels during times of light volume which triggers/shakes traders out of their positions.
Trading during low volume sessions Pre/Post holidays for swing traders or between 11:30am – 3:00pm ET for day traders tends have increased volatility and false breakouts. This happens because the market markets for individual stocks can slowly walk the prices up and down beyond short term support and resistance levels simply because there is a lack of participation in the market.
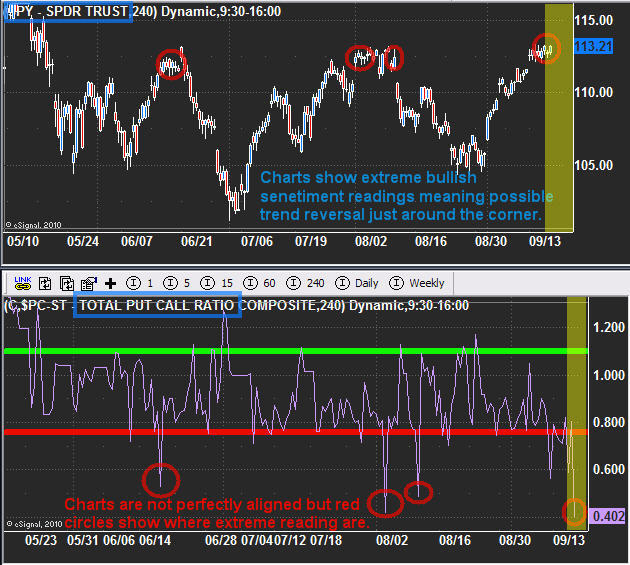
SP500 4 Hour Candlestick Chart
That being said, the chart below of the SPY (SP500 ETF) shows that last Thursday, (the day before Friday options expiry) the put call ratio was showing extreme bullishness. I also mentioned that we should expect a pop of 0.5 -2% in the next 24 hours as big guys will try to shake everyone out of their short positions (put options).
The put/call ratio indicator at the bottom of this chart is a contrarian indicator. When it shows that everyone has jumped to the bullish side, the big money knows its about time to change the direction so they can cash in at premium price levels.
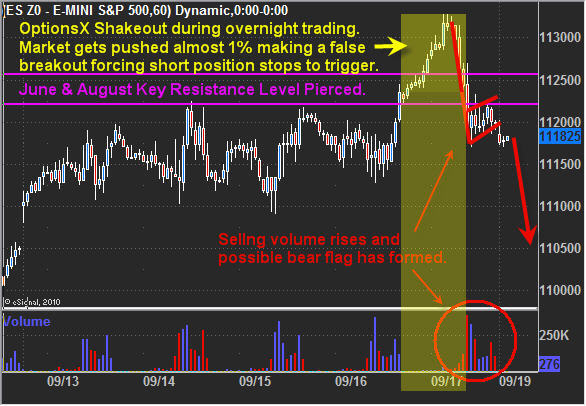
SP500 60 Minute OptionsX Chart of the Week
If you look at the volume at the bottom of the chart you will see there are times where this virtually zero volume trades. The yellow high lighted section shows the overnight price surge which is very easy for the big guys to push higher as everyone sleeps.
Here is what they are doing. The light volume makes it easy to manipulate so they push it higher until key resistance is broken, then everyone who was short and had a protective stop in place will have their order executed. As the price rises, more and more stops get triggered. Also, with the rising number of traders becoming bullish from the previous session have buy orders to go long if key resistance is broken. This causes a virtually automated rally to unfold, but once the orders/buying dries up, the big guys start selling their positions at premium prices, pushing the price all the way back down to where the market closed the previous day.
In short, the big guys shook the majority of traders out of their positions Thursday night and pocketed a ridiculous amount of money. Crazy part is 99% of the public don’t even know this type of thing is happening while they sleep.
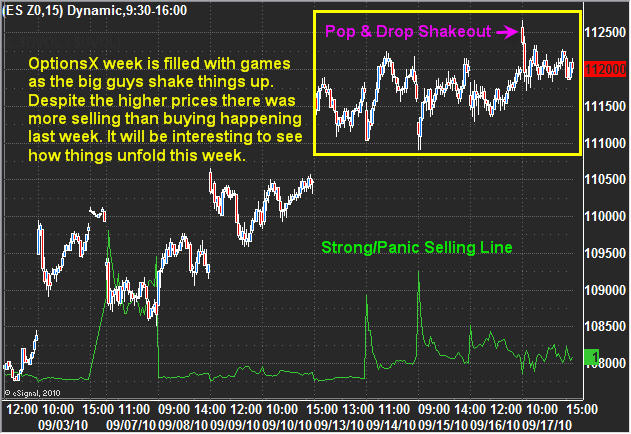
SP500 OptionsX Intraday Price Action
I thought I would show this chart as it shows the selling pressure in the market. What I find interesting about this chart is the fact there was more selling volume during options expiry week, but the prices continued to move higher.
From watching the market internals I saw the majority of traders go from bearish to bullish by the end of the week, and this really gave the big guys a huge advantage in my opinion. Each session selling volume took control with the big guys unloading bu the low volume afternoons naturally brought prices up again as more and more traders became bullish each session. This happened all week and Thursday night it looks as though they let the price rise allowing the key resistance level to be broken which caused a surge of buying which they could selling into. So what’s next…
SP500 / Broad Market Trading Conclusion:
In short, the market looks toppy and if all goes well, last weeks overnight shakeout just may have been a top. This week will start off slow and most likely with light volume until Wednesday. During light volume times, keep trading positions smaller than normal and remember there is a neutral/upward bias associated with light volume.
You can get my ETF and Commodity Trading Signals if you become a subscriber of my newsletter. These free reports will continue to come on a weekly basis; however, instead of covering 2-4 investments at a time, I’ll only be covering only one. Newsletter subscribers will be getting more analysis that’s actionable. I’ve also decided to add video analysis per customer’s request, and I’ll be covering more of the market to include currencies, bonds and sectors. Before everyone’s emails were answered personally, but now my focus is on building a strong group of newsletter traders and they will receive direct personal responses regarding trade ideas and analysis going forward.
Let the volatility and volume return!
If you would like to receive my Trading Analysis and Signals Complete with Entry, Targets and Protective Stops please visit my website at: www.TheGoldAndOilGuy.com
By Chris Vermeulen
Chris@TheGoldAndOilGuy.com
Please visit my website for more information. http://www.TheGoldAndOilGuy.com
Chris Vermeulen is Founder of the popular trading site TheGoldAndOilGuy.com. There he shares his highly successful, low-risk trading method. For 6 years Chris has been a leader in teaching others to skillfully trade in gold, oil, and silver in both bull and bear markets. Subscribers to his service depend on Chris' uniquely consistent investment opportunities that carry exceptionally low risk and high return.
This article is intended solely for information purposes. The opinions are those of the author only. Please conduct further research and consult your financial advisor before making any investment/trading decision. No responsibility can be accepted for losses that may result as a consequence of trading on the basis of this analysis.
Chris Vermeulen Archive |
© 2005-2022 http://www.MarketOracle.co.uk - The Market Oracle is a FREE Daily Financial Markets Analysis & Forecasting online publication.