


Using Iron Condors to Create Profits Trading SPX
InvestorEducation / Options & Warrants Sep 18, 2010 - 05:12 AM GMTBy: Chris_Vermeulen

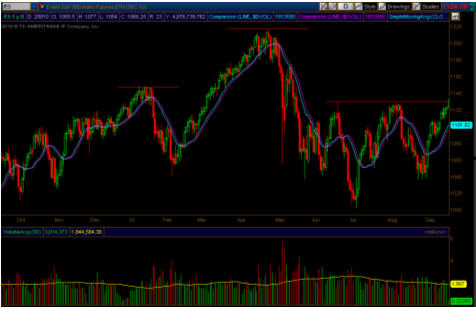
 This recent rally has many market pundits believing the market will continue higher, fueled by slightly improved economic data points. The bulls realize that the all important S&P 1130 level is not that far overhead; if they can push the SPX through that level with strong volume, a rally could play out. The charts below are using the S&P E-Mini contract for analysis purposes.
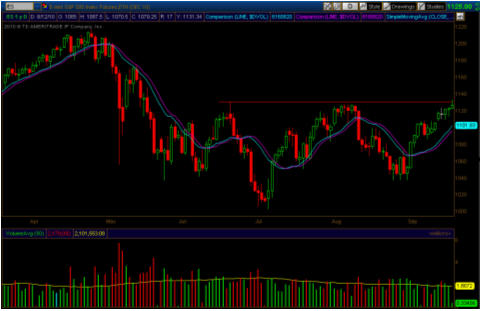
In contrast, the bears look at the S&P noting the ever present head and shoulders pattern as well as the potential triple top formation should the S&P 1130 resistance level hold. While the S&P 1130 level is critical for the bulls, the bears view it as the final stand. The bears realize that if they cannot hold the 1130 level, their party will end and the bulls will happily rub it in their face.
So what is a trader to do? The first advice worth offering is to utilize patience. Let others do battle and wait for the market to confirm a specific direction. Professional traders always have a plan before they enter a trade and they consistently utilize stops to define their risk. The very best of traders do not allow their opinions or the opinions of others to cloud their judgment; professional traders will abruptly change their trading plans in order to adapt to changing market conditions.
Trading is all about perception and leveraging probability. Regardless of whether a trader utilizes technical analysis, fundamental analysis, or the newspaper-dart method the very best traders realize that consistently taking money out of the market is more about managing emotions and probability than anything else.
The market always leaves clues behind, but if a trader is too biased in one direction or the other he/she becomes blind to clues that do not fit his/her directional bias. The current state of affairs in the S&P 500 offers another quality setup, regardless of which bias a trader has. With option expiration looming, a new option cycle presents itself with expiration at the end of September (Quarterly's). My most recent missive focused on option butterflies, however the situation we have currently on the S&P calls for a wider trading range. We now find ourselves in condor season.
Condors and iron condors have similar setups, but they have slightly different constructions. Theta (time decay) is the primary profit engine just like traditional butterflies; the only difference is that condors and iron condors offer potentially wider profit zones than a traditional butterfly. Similar to butterflies, condors are susceptible to volatility shocks, expanding implied volatility on the underlying, and gamma risk can also present itself and negatively impact a trade's overall performance.
The most important thing to remember about option trading is that as one progresses in his/her overall option knowledge, options allow a trader to modify their position to reduce risk and allow positions to become profitable.
While both types of condors are susceptible to the same risks, their primary functional difference is based around their construction. Both condors and iron condors have 4 separate and specific legs. A traditional condor utilizes 4 option contracts of the same type; 4 calls or 4 puts. Iron condors utilize a mixture of calls and puts; 2 calls and 2 puts. Another primary difference is that condors are a debit trade, while iron condors are a credit trade.
In this week's example we will use an iron condor strategy to set up a trade. The trade will not have a directional bias, instead we will simply use the passage of time as our profit engine. We will use the S&P 1130 level as our midpoint, and build the wings of the iron condor equidistant from that level. Trading the cash settled SPX index options or trading options on the S&P 500 futures requires more capital and the acceptance of greater risk.
A trader with less capital could utilize the SPY in the same manner, with less capital at risk and tighter bid/ask spreads. For accounts exposed to the ravages of the tax system, it is important to remember there is preferential tax treatment of the cash settled index options and futures options that are not present in the SPY.
The iron condor is set up using 4 separate option contracts - 2 calls and 2 puts. The iron condor has the following construction ratio: Long 1 Put/Short 1 put/Short 1 Call/Long 1 Call. Each of these two vertical spreads is constructed as a credit spread. In our case, we are going to use the following strike prices for our example. Keep in mind, a trader willing to take more risk could use strikes which are closer for the potential of higher returns (more risk). On the other hand, those who are more risk averse could move the short strikes further apart for a lower return (less risk).
The chart below represents the profitability of an SPX iron condor using the following trade construction: Long 1 Sept (Quarterly) SPX 1050 Put/Short 1 Sept. (Quarterly) 1060 Put/Short 1 Sept. (Quarterly)1165 Call/Long 1 Sept. (Quarterly) 1170 Call. For further detailed information, prices used to produce this iron condor were based on the Thursday close and the midpoints of the bid/ask spread on all contracts. The profitability reflected below is based on a 1/1/1/1 setup. Obviously if a trader decided to add more contracts the max profit and loss would increase. Keep in mind, this example is for educational purposes only and is not reflective of intraday market prices.
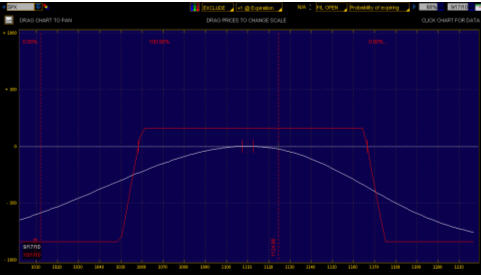
The red line represents profit/loss at expiration. The white line represents profit today. As you can tell, the potential profit for today is essentially zero unless a substantial deterioration of implied volatility was to occur. The key to this entire trade is the passage of time. If the SPX stays within SPX 1060 and SPX 1165 price at expiration on September 30th the trade will realize the maximum of profit of $160. The total risk taken by this trade would be $840.
The beauty as always with options is that risk is crisply defined. The absolute most you could lose on this trade regardless of what happens is $840 per side. As a side note, the probability of SPX's price remaining between the 1060-1165 price range over the next two weeks is around 70% based on a log normal (Gaussian) distribution of prices.
Additionally, iron condors can be manipulated throughout their lifespan to defend profits. The ability to make slight changes to the construction by purchasing slightly out of the money puts/calls can also help protect profits if price gets near the edge of the profitability window. A myriad of strategies exist once this trade is placed to adapt to ever changing market conditions.
As an example, let us assume that price goes higher to around SPX 1150 in one week. At that price point, we could close the put portion of the condor for the maximum gain and then restructure our condor to protect the call side with a slightly out of the money call purchase and/or another put credit spread at a higher strike point taking in more premium and further reducing our risk.
After a trader becomes proficient with the various option trading strategies, he/she can constantly adapt positions to prevent further losses. After all, options were designed primarily as a means to hedge equity positions and reduce risk.
In closing, the iron condor strategy can be profitable regardless of which direction an underlying's price goes. There is no guesswork or fake outs, as long as the inevitable passage of time continues and price stays within the contracts that were sold to open the position, a near 19% return is possible based on capital at risk.
If you would like to receive my Trading Analysis and Signals Complete with Entry, Targets and Protective Stops please visit my website at: www.TheGoldAndOilGuy.com
By Chris Vermeulen
Chris@TheGoldAndOilGuy.com
Please visit my website for more information. http://www.TheGoldAndOilGuy.com
Chris Vermeulen is Founder of the popular trading site TheGoldAndOilGuy.com. There he shares his highly successful, low-risk trading method. For 6 years Chris has been a leader in teaching others to skillfully trade in gold, oil, and silver in both bull and bear markets. Subscribers to his service depend on Chris' uniquely consistent investment opportunities that carry exceptionally low risk and high return.
This article is intended solely for information purposes. The opinions are those of the author only. Please conduct further research and consult your financial advisor before making any investment/trading decision. No responsibility can be accepted for losses that may result as a consequence of trading on the basis of this analysis.
Chris Vermeulen Archive |
© 2005-2022 http://www.MarketOracle.co.uk - The Market Oracle is a FREE Daily Financial Markets Analysis & Forecasting online publication.