Learn How to Forecast Markets Using Technical Analysis
InvestorEducation / Learn to Trade Sep 17, 2010 - 11:42 AM GMTBy: EWI
 There are two camps of market analysts out there: the fundamental camp and the technical one. Fundamental analysts look at things like the GDP, unemployment, interest rates, etc. to make logical assumptions about where the stock market is going.
Technical analysts use none of that. They look at the market's internals to gauge the trend: things like momentum, trend channels -- and yes, Elliott wave patterns.
And this is your free chance to learn how they do it.
We've put together a free 54-page Club EWI resource for you, "The Ultimate Technical Analysis Handbook." Below is a short excerpt from chapter 3. Enjoy! (For details on how to read this free report in full, look below.)
The Ultimate Technical Analysis Handbook Chapter 3: How To Integrate Technical Indicators Into an Elliott Wave Forecast By EWI's Senior Tutorial Instructor Jeffrey Kennedy
I love a good love-hate relationship, and that’s what I’ve got with technical indicators. Technical indicators are those fancy computerized studies that you frequently see at the bottom of price charts that are supposed to tell you what the market is going to do next (as if they really could). The most common studies include MACD, Stochastics, RSI and ADX, just to name a few.
I often hate technical studies because they divert my attention from what’s most important -- PRICE. ... Nevertheless, I have found a way to live with them, and I do use them. Here’s how: Rather than using technical indicators as a means to gauge momentum or pick tops and bottoms, I use them to identify potential trade setups.
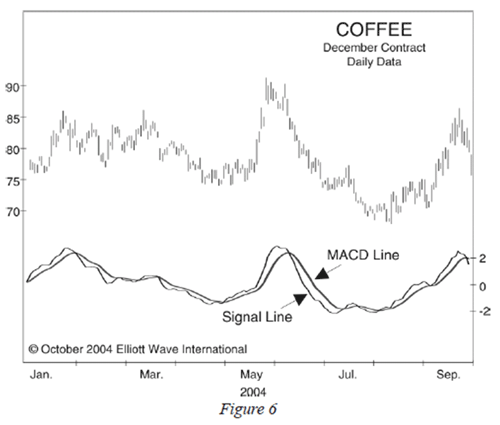
Out of the hundreds of technical indicators I have worked with over the years, my favorite study is MACD (an acronym for Moving Average Convergence-Divergence). ... Even though the standard settings for MACD are 12/26/9, I like to use 12/25/9 (it’s just me being different). An example of MACD is shown in Figure 6 (Coffee).
The simplest trading rule for MACD is to buy when the Signal line (the thin line) crosses above the MACD line (the thick line), and sell when the Signal line crosses below the MACD line. Although many people use MACD this way, I choose not to... I like to focus on different information that I’ve observed and named: Hooks, Slingshots and Zero-Line Reversals. Once I explain these, you’ll understand why I’ve learned to love technical indicators. ...
Chapter 1: How the Wave Principle Can Improve Your Trading Chapter 2: How To Confirm You Have the Right Wave Count Chapter 3: How To Integrate Technical Indicators Into an Elliott Wave Forecast Chapter 4: Origins and Applications of the Fibonacci Sequence Chapter 5: How To Apply Fibonacci Math to Real-World Trading Chapter 6: How To Draw and Use Trendlines Chapter 7: Time Divergence: An Old Method Revisited Chapter 8: Head and Shoulders: An Old-School Approach Chapter 9: Pick Your Poison... And Your Protective Stops: Four Kinds of Protective Stops
Get more lessons like the one above in the free 50-page Ultimate Technical Analysis Handbook. Learn more and download your free copy hereThis article was syndicated by Elliott Wave International and was originally published under the headline Your Free Chance to Learn How to Forecast Markets Using Technical Analysis. EWI is the world's largest market forecasting firm. Its staff of full-time analysts led by Chartered Market Technician Robert Prechter provides 24-hour-a-day market analysis to institutional and private investors around the world.
About the Publisher, Elliott Wave International
Founded in 1979 by Robert R. Prechter Jr., Elliott Wave International (EWI) is the world's largest market forecasting firm. Its staff of full-time analysts provides 24-hour-a-day market analysis to institutional and private around the world.
© 2005-2022 http://www.MarketOracle.co.uk - The Market Oracle is a FREE Daily Financial Markets Analysis & Forecasting online publication.


