Yen Intervention Wednesday - Kan Baffles Bulls
Stock-Markets / Financial Markets 2010 Sep 15, 2010 - 01:40 PM GMTBy: PhilStockWorld

 As we discussed yesterday, it was meet the new boss, same as the old boss in Japan as Naoto Kan’s re-election sent the Yen to new highs as he was considered the least likely candidate to back intervention. Well surprise, surprise this morning as Japan officially intervened in the FOREX markets and sent the Yen down a full 2.5% as they used their Yen to purchase an undisclosed basket of currencies.
 Since the Dollar is up today against both the Pound ($1.55) and the Euro ($1.29), we can assume the dollar is one of those currencies and demand for Dollars means upward pressure on rates so that should be the end of the TLT bounce for the moment. Stock boys want bonds to die so the money can come this way and bond boys want you to fear the stock market so you will let them hold your money (and charge you fees) at ridiculously low rates of interest. That’s they Yin and Yang of the markets.
“Investors were starting to doubt the government’s commitment to its pledge that it would take bold action,” said Yoshimasa Maruyama, a senior economist at Itochu Corp. in Tokyo. Kan and Noda in recent weeks repeatedly said that Japan was ready to take “bold” measures to stem the currency. The Japanese government official said European and U.S. officials were informed of the move in an effort to avoid a negative reaction. It took a while to convince Europe because authorities there didn’t like the idea, the person said.
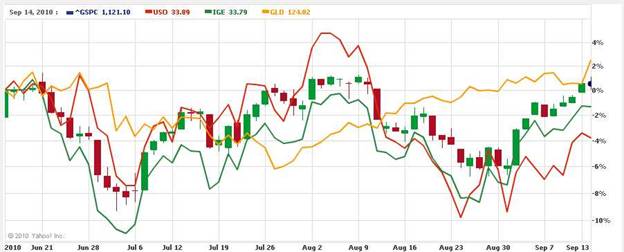
We’ll see if the stronger Dollar today puts pressure on commodities but we’re in pretty good shape as this rally, for a change, has not been led by commodities as the market is now flat to the August despite an 8% drop in oil prices (see USO on chart):

I often complain about rallies that are led by Financials and Commodities as those are things that suck money OUT of the economy and are not long-term drivers of growth. The entire 2006-7 rally was this kind of rally and I bitched about it all the way up. We also had housing back then, another type of commodity, but that’s so dead now it’s hardly worth mentioning, is it? Actually housing is where we used a lot of commodities like lumber and copper etc. 33 months after the onset of the Great Recession, new home sales are still down 70% and non-residential construction is down 36% - that market is dead, dead, dead.

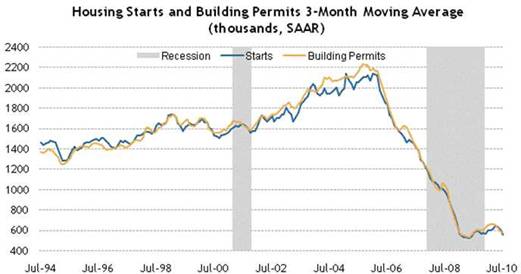
We get housing starts next week but who really cares? Is it going to be 525,000 or 575,000? I can tell you one thing, it’s not going to be 2.1M, which is where we peaked out in 2006 and it’s not going to be 1.4M, which was around "normal" in the 90s. While many bears will latch onto this number and tell you how it spells DOOM for the economy - I’ll give you a couple of reasons why it’s a GOOD thing.
A) Commodities - they get expensive when housing sucks them all up and that makes the cost of goods more expensive for consumers as well as for manufacturers.
B) Savings - With an average price of $250,000 and an average deposit of 10%, each new home sucked $25,000 out of savings accounts - 1.5M less homes sold means $37.5Bn more money in savings accounts. Ad in mortgage fees, moving costs etc. and you can double that amount. Also, it pays to consider the vast number of people who have simply stopped saving for a new home as it is no longer considered a goal for many people - that money can be used for other purchases or to pay down debts. If the average family saved 3 years to buy a new home than that’s a very large amount of money that has been re-directed.
C) Loans - If they are putting down a $25,000 deposit, they are borrowing $225,000 from the bank. That’s a demand for $337.5Bn per year of bank capital. Less demand for money for homes means more money available (in theory) for businesses to expand (and hopefully hire).
D) Cash flow - Hard to quantify but generally, people who stay in homes can afford their mortgages, the stress comes when they upgrade to bigger homes and have to make bigger payments.
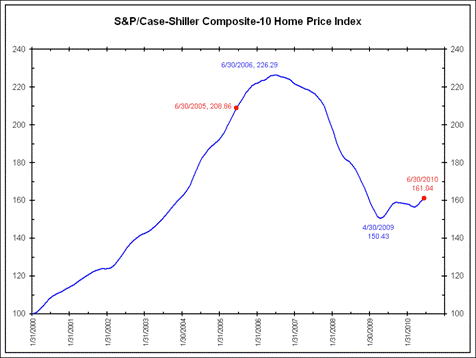
To some extent, the same thing applies to the 6M cars per year that are not being bought as well. Of course, cars only last so long before they begin falling apart but so, to some extent, do homes. At 500,000 homes a year we are only replacing the average US home every 205 years. Is your home likely to last 205 years? If not, then at some point, people will HAVE to start buying new homes again. If we assume 1.5M homes a year is a proper replacement rate (once every 73 years for 110M homes), then we can use the above chart and estimate that about 1.5M homes too many were built between 2003 and 2006 while about the same 1.5M too few homes have been built in the past two years. This is called "working off excess inventory" and it’s very, very normal and explains whey the Case-Shiller Index has found a bottom of sorts recently:

Interest rates are the real wild-card here as people don’t buy homes, they buy mortgages, so low home loan rates (remember that low demand for money) makes homes seem more affordable and it remains to be seen if buyers really have the stomach to pay 70% of peak home pricing if rates head back to 6%. At 4.5%, a $200,000 mortgage is $1,266.71 per month, at 6%, that $200,000 jumps to $1,498.88 per month - a 15% increase. So, we can look at the above chart and knock 15% off if rates had not dropped so significantly during the housing bust and that puts the chart at 136. 7.5% mortgages can drive us down to about 115 so it is not out of the realm of possibility that an event (like the Yen being devalued to the dollar, for one thing) can still drive rates up and drive housing prices another 15-30% lower.
This is what we consider to be one of the biggest overhangs in the economy because we are not creating enough jobs to create demand for homes and every day we risk an event that raises rates and the banks are still on the hook for 3 years worth of home loans they made at higher prices than those homes are likely to fetch today and that deficit in their loan to value ratios can get MUCH worse very quickly if we do have a rate event and that line drops from 160 to 130 to 115, which would put a whole decades worth of home loans deeply in the red on the banks’ books (if they ever actually mark them that way, of course).

Don’t be fooled by the recent bounce in financial stocks, Louis Navellier warned yesterday. "High foreclosure rates and low lending rates are acting against the big banks," he says, urging investors to sell: STD, BAC, BCS, LFC, C, HBC, GS, JPM, LYG, RBS, WFC. This morning we got the MBA Mortgage Application Report and that was down 8.9% for the week, despite the fact that the 30-year fixed rates fell from 4.5% to 4.47%. When I met with the Treasury last month, we discussed rates and (we are not allowed to be specific) I got the impression that they were not all together against the idea of seeing rates drop to 1% if they thought it would actually boost housing but, in fact, they don’t. That foreclosure rate and lack of new buyers is going to keep housing down for quite a while but, as long as it doesn’t get worse, as I said, not such a bad thing…
This overall uncertainty is why we held onto our hedges yesterday as we were only testing the top of our range, so we expected some pullback anyway. We took advantage of the morning pop to add SQQQ and TZA hedges and we’ll be out following our 3 of 5 rule if we can get over our lines but seeing the Russell struggle to hold the 2.5% line at 650 made us a little dubious as to whether they would be joining us at the 5% mark. Oil failed to hold $77.50 and copper failed to break $3.50 and gold went higher - all things to make us nervous but not so nervous that we didn’t like ARNA on the dip as a fun, risky trade idea that will make or break on Thursday, when the FDA makes their decision.
 We set up a hedged play on ARNA that pays 1,566% at $5, which is a fun way to gamble on silly biotech stocks. The idea of a play like that, of course, is not to put 1% of your portfolio in and hope to make 15 times your portfolio on one trade but to put 0.01% of your portfolio and make 15% if it works out. That way, you can afford to have 10 misses trying to make 15% before you are out even one tenth of one percent of your portfolio - we see trades like these at least once a week so it’s not like they are a rarity.
Asia was mixed this morning with the Shanghai getting hit for 1.3% but the Hang Seng held flat at 21,752 and that 22,000 line would be bullish for them. The BSE hit 19,502 with a 0.8% gain and the Nikkei was thrilled with the intervention and jumped 2.3%. Europe is down about half a point ahead of the US open as protests against austerity budgets broke out in Romania and the EU proposed a ban on short selling that made the markets nervous.
Also making everyone nervous is our miss on Industrial Production (0.2% vs 0.3% expected) as well as Capacity Utilization (74.7% vs 75% expected) and the Empire Manufacturing Index for September also fell short of the mark at 4.1 vs 6.4 expected and 7.1 prior. If that kind of data keeps up, then the August "recovery" is going to start looking like a bump on the way down. However, new orders were the bright spot of the report, up 4.33 vs down 2.71 last month while employment ticked up slightly and prices turned higher. August Import Prices were up a surprising 0.6%, doubling expectations.
We expected to test our 4% lines today and we’ll see if they hold up at: S&P 1,112, Nas 2,288 and NYSE 7,072. The Dow has yet to give us 10,608 nor has the Russell seen fit to test 660 but these are the expected pullbacks off our 5% lines and the other 3 have tested the tops and how they behave on a pullback is going to be critical as we decide on our stance into the weekend. It’s very had to make any conclusions on a day where there has been such a massive currency intervention and I would take all early moves with a huge grain of salt.
By Phil
Philip R. Davis is a founder of Phil's Stock World (www.philstockworld.com), a stock and options trading site that teaches the art of options trading to newcomers and devises advanced strategies for expert traders. Mr. Davis is a serial entrepreneur, having founded software company Accu-Title, a real estate title insurance software solution, and is also the President of the Delphi Consulting Corp., an M&A consulting firm that helps large and small companies obtain funding and close deals. He was also the founder of Accu-Search, a property data corporation that was sold to DataTrace in 2004 and Personality Plus, a precursor to eHarmony.com. Phil was a former editor of a UMass/Amherst humor magazine and it shows in his writing -- which is filled with colorful commentary along with very specific ideas on stock option purchases (Phil rarely holds actual stocks). Visit: Phil's Stock World (www.philstockworld.com)
© 2010 Copyright PhilStockWorld - All Rights Reserved Disclaimer: The above is a matter of opinion provided for general information purposes only and is not intended as investment advice. Information and analysis above are derived from sources and utilising methods believed to be reliable, but we cannot accept responsibility for any losses you may incur as a result of this analysis. Individuals should consult with their personal financial advisors.
© 2005-2022 http://www.MarketOracle.co.uk - The Market Oracle is a FREE Daily Financial Markets Analysis & Forecasting online publication.


