


Theory 144 and Disequilibrium Explain Stock Market Price Action, EMH RIP
Stock-Markets / Stock Markets 2010 Sep 15, 2010 - 11:26 AM GMT

 The idea that markets tend toward a state of equilibrium is a fundamental principle of the efficient-markets hypothesis (EMH). This hypothesis, based on an equilibrium driven world, has ruled academia and served as a primary driver of institutional investment decision making for decades. However, it remains a hypothesis because after decades of analysis it has not delivered sufficient real-life evidence and data to attain the level of a theory. Wild market swings, such as the 2007-2009 global market crash, and the flash crash of May 2010, where unbridled greed cowered before the onslaught of fear, confirms that the EMH belongs in the dustbin of failed financial hypothesis.
A theory that actually explains why markets behave the way they do, with extreme price swings, is required. Theory 144, which recognizes disequilibrium as a natural force to embrace and not fear, actually explains market price action.
Anyone that has ever studied financial market charts recognizes that disequilibrium and not equilibrium is inherent in market action over time. The real issue at stake between opposing theories of equilibrium vs. disequilibrium comes down to what is driving the market, the two extreme points of disequilibrium and the competing forces that produce it, or the mid-point of their field of action. Since the two extremes actually define the mid-point, it is likely that the competing forces that produce the two extremes are running the show.
Theory 144 embraces the obvious disequilibrium in markets and is a natural replacement for the efficient-markets hypothesis. Theory 144 deserves consideration by perceptive and deep thinking investors and traders around the world not interested in failed hypotheses. First, respect for the recently deceased is in order. The EMH deserves a descent burial.
A growing list of investors and analysts recognize problems with the EMH. Warren Buffett is often quoted as saying, “I’d be a bum on the street with a tin cup if markets were efficient.” Nobel economist Joseph Stiglitz, and other academics, recognize that markets are wild and ruthless and have blamed the EMH for leading government planners astray. They suggest that EMH takes a large part of the blame for the global financial crisis. Of course, Stiglitz is advocating more government control and regulation as the solution, but to his credit, he recognized the importance of information asymmetry (a form of bad data), which plays an essential role in disequilibrium. Stiglitz has it backwards; government involvement has actually made things worse, decreased efficiency and increased information asymmetry and market disequilibrium; Fannie Mae and Freddie Mac are two examples of government fingers in the financial market pie that produced massive asymmetry for millions of homeowners now holding underwater mortgages. Thank you Uncle Sam. Many are blaming free markets for problems created by governments, what nonsense.
Government intervention and state corporatism did not let markets do their job, punish foolish behavior, and unwind malinvestment. Markets would be far more efficient without government intervention, but the EMH would still not be valid, since the evidence suggests disequilibrium is in the very DNA of markets, and actually describes the way they work very nicely.
Ideas have consequences. One school of thought that is the natural offspring of EMH is convinced randomness rules in markets and fails to recognize that even chaos has deep order not readily apparent. This random approach to market price action was made famous in the book, A Random Walk Down Wall Street. The approach implies that neither technical analysis nor fundamental analysis will improve investment performance, since markets are efficient and devoid of disequilibrium that traders and investors can recognize and exploit. The natural conclusion of such thinking is that if all price activity on Wall Street is random, you just need to give your money to an index fund manager and let them drive your capital right over an efficient market cliff, into the abyss of a disequilibrium extreme that always enjoys punishing such foolishness.
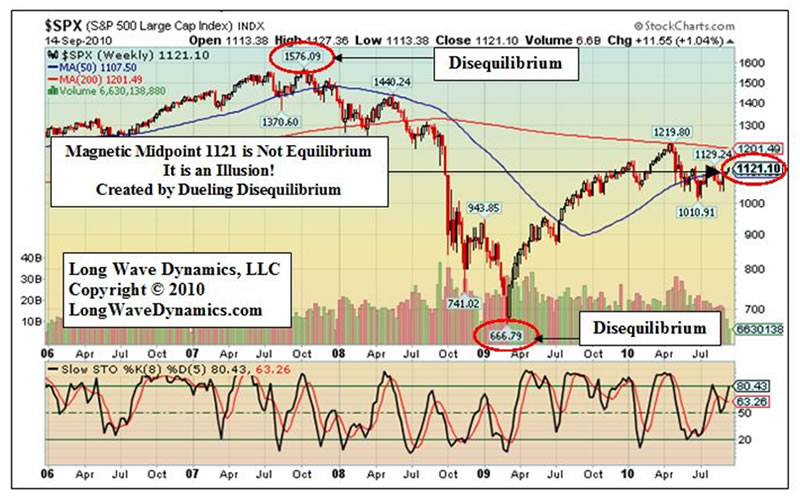
Fortunately, the forces of disequilibrium at work at any given moment in space and time conveniently leave a crumb trail in the form of a major index stock chart like the S&P 500, kind of like in the tale of Hansel and Gretel, which helped them find their way out and escape the wicked witch. The 2007-2009 stock market crash provides a reasonably large-scale print of disequilibrium and is an example of the problem for the EMH.
The intraday S&P 500 top tick came in October 2007 at 1576.09, and the low tick in March at 666.79, only 14 months later. It is difficult for EMH advocates to argue that these two price turns represent global financial markets in a state of equilibrium bliss, or that efficient allocation of capital ruled the day. These two extremes are not examples of efficiency; they are examples of inefficiency and markets moving to extremes, driven by the actions of millions of participants and something other than rationality.
Theory 144 uses Fibonacci ratios to discover active price grids that explain current market action in terms of disequilibrium. Fibonacci ratios from 0% to 100% generate Fibonacci price targets in a disequilibrium grid, but not all Fibonacci ratios and therefore price targets are created equally. The golden ratio of 61.8% and the inverse golden ratio of 38.2% are the dominate Fibonacci ratios in any grid.
In every Fibonacci price level grid there are three ranges that produce a dynamic web within the Fibonacci price grid; 1) Solitude 0-38.2%, 2) Normal 38.2-61.8%, and 3) Frenzy 61.8-100%. The Normal range contains the magnetic mid-point in every range at 50%, which is also a Fibonacci ratio. If there is such a thing as equilibrium, the magnetic mid-point is it. However, the two extreme points of disequilibrium in the Fibonacci price grid define the magnetic mid-point, so it is not the real deal. Important: I repeat, the two extreme points in the Fibonacci price grid level produce the magnetic mid-point, and not the other way around, thus explaining why Theory 144 is a theory rooted in the mechanizations of disequilibrium and not equilibrium. The S&P 500 is currently trading at the magnetic mid-point of the entire 2007-2009 collapse, which is relevant, but is not the magnetic mid-point of the 1982-007 bull, which comes in down at 839.25, which this market is expected to visit again on the way to its ultimate disequilibrium driven destination.
Presented below is an example of a Fibonacci price grid and the ranges within the grid. This price grid is a Level 1 grid that reflects the entire range of the 1982-2007 bull markets. The two extremes of the 1982 price low and the 2007 price high produce the full range of the price grid. It does not represent the boundaries of equilibrium, but boundaries of disequilibrium.
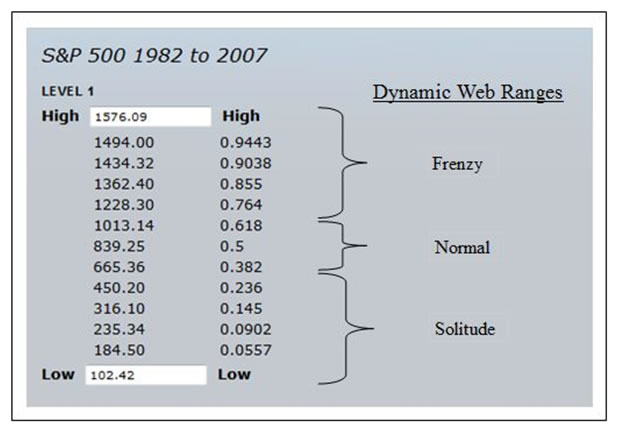
If you believe markets are efficient, you were not likely interested in the inverse golden ratio of 38.2% of the entire move at 665.36. This target marks the boundary between the Solitude range below and the Normal range above in the dynamic web of this large Fibonacci price grid. If you recognize that disequilibrium drives markets in a dynamic web, ordered by Fibonacci ratios in price and time, you are always very interested in a golden and inverse golden target price. The fact that the market crashed from over 900 points above that number to only a few ticks from that number in March 2009, and then reversed, is an important observation. This suggests that you have a hot price grid on your hands, driven by the disequilibrium of a dynamic market full of millions of actors on the global stage of finance, economics and politics, in short, the entire social order.
Theory 144 proposes that an interconnected web of disequilibrium, and not equilibrium, dominates global financial markets and economic activity, and sufficient evidence exists to offer it as a theory. Equilibrium is just a transient point in space and time where the many ships representing the opposing forces of disequilibrium pass in the night. Disequilibrium is the dominant characteristic of markets. Disequilibrium occurs on multiple levels of cycles in price and time, from the Kondratieff long wave down to the 20-week “Wall” cycle. The actual name Theory 144 comes from the fact that a long wave divided by 144 produces a 20-week Wall cycle, discovered by PQ Wall, the implications of which will rock the world of investors and traders. Theory 144 is a theory precisely because sufficient evidence exists for it to rise above the level of mere hypothesis.
Supply and demand are just two of the forces of disequilibrium that rule in markets, but there are many more. In fact, the forces of disequilibrium are likely at work in many millions of opposing and sometimes aligned interests, with billions of actors at work and play in the global system. Even the child that chooses to buy bubble gum instead of a soft drink in Mumbai India is an actor in the dynamic web of global human action, granted, not as big an actor as Federal Reserve Chairman Bernanke when he is setting the federal funds rate, or fires up his helicopter, but an actor nonetheless.
Was the 2007-2009 price crash in the S&P merely the result of all the actors on the stage of global finance processing new information every moment of every day in a perpetual state of equilibrium? No, inefficiency, greed, fear and angst were explicit forces that played out on the global stage of this wide market swing in such a relatively short period. Studying such moves, equilibrium is not the first word that comes to mind, but disequilibrium.
The EMH allows individuals to have irrational expectations, but not the entire market. Theory 144 proposes that global markets are nothing more, nothing less, than the sum of individual irrational and occasionally rational expectations reflected in prices. Uncle Sam, the sum of public employee actors and their actions, is still guaranteeing the irrational expectations of public and private sectors with the full faith and credit of the American taxpayer, who is rapidly losing faith. Is this a rational move by government?
Theory 144 recognizes that prices move in Fibonacci price grids on multiple levels. The first order of business is to identify the major Level 1 price grid of the market to which you wish to apply dynamic web theory, see the Level 1 grid above for the entire 1982-2007 bull market. The Level 1 price grid may cover years or even decades of a price movement from an important low to an important high. The intraday price low and intraday high create the Level 1 grid.
Once you have identified the low and high of the Level 1 grid, you can generate the Level 1 price grid and the Fibonacci ratio price targets in that grid, using the low as 0% and the high as 100%. From the Level 1 grid, you can drill-down into the current Level 2 Fibonacci grid by using the two adjacent Fibonacci ratios and prices on either side of the current market price. See the Level 2 price grid below. This is the current active “hot” price grid in the 1982-2007 bull market.
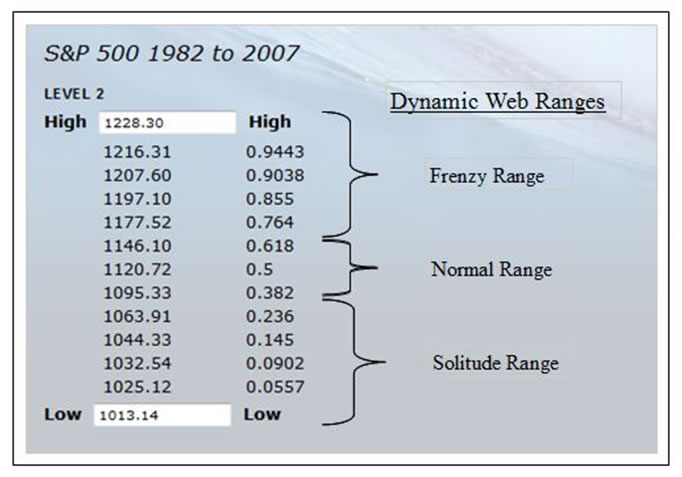
Repeating this process of taking two adjacent Fibonacci price targets, you can drill down to Level 3. This Fibonacci level drill-down process reveals the Fibonacci order in market price action that is influencing prices on an intraday basis. The following two Level three grids are the ones on either side of the Leve 2 target price of 1120.72.
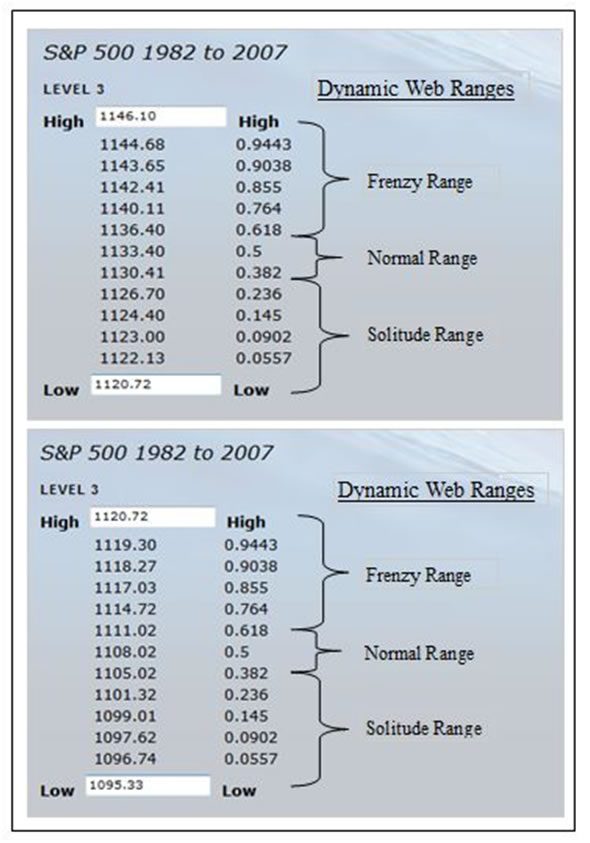
The market’s disequilibrium driven dynamic web ranges within a given Fibonacci price grid level hold the keys to the market’s direction. Markets in the Solitude range of any price grid risk falling back into the Frenzy range of the next lower price grid of the same level, and the larger more important grid levels. Markets in the Normal range of any Fibonacci grid level are consolidating and preparing their attack into the Frenzy range, which gives them a shot at the next level, or they are spending their energy treading water, and are at risk of falling back into the Solitude range and then through support and into a lower price grid. Observe the S&P 500 intraday market action in these grids and you will recognize why Theory 144 is more than a mere hypothesis.
Tracking market action in the dynamic web ranges of the Fibonacci price grid provides clues to the market’s direction. Investors and traders should track these movements at different cycle scales of price and time. Investors will be more interested in tracking market moves in price and time related to the business cycles, while traders are more interested in the 20-week cycle, what we have termed the Wall cycle, and the Quarter Wall cycle, which provides clues regarding the direction of the unfolding Wall cycle.
Looking at the Level 1 grid above warrants a few relevant observations. The S&P 500 1013.14 Level 1 golden ratio price target is supporting the entire edifice of global markets in the frenzy range of the late great 1982-2007 bull market. If that price goes, a wave of disequilibrium will roil global markets, bringing the pricing structure of many financial and hard assets around the globe into question. Be prepared for disequilibrium, because equilibrium is only an illusion that is a transient point in space and time between two extremes of human action in markets, both rational and irrational. When illusions of equilibrium are shattered, some observers may be tempted to call it a black swan event.
How could Theory 144 possibly be onto the driving forces behind such broad based market price action? Simply because disequilibrium and Theory 144 actually represents how markets actually work, and because individual investors, major traders, hedge funds and high-frequency traders recognize that it works, and the programming of various aspects of the theory into trading platforms makes the theory even more relevant to market analysis.
Fibonacci price grids alone are valuable tools for investors and traders. However, Theory 144 does not stop with price. The other half of Theory 144 deals with cycles in time briefly mentioned in this article. Cycles in time produce order from chaos interwoven with market action in price. Degrees of freedom expressed in Fibonacci ratios dictate the length of cycles. A future article will expand on the subject of Theory 144 cycles in time.
Cycles such as the 20-week cycle, regular business cycles and even the long wave go a long way toward explaining market action, but Theory 144 recognizes that they have degrees of freedom in Fibonacci ratios that fluctuate on either side of their “ideal” lengths. Theory 144 provides an explanation and a framework for the impact of disequilibrium in price and time on market prices. However, clearly market action can occasionally create the seductive illusion of equilibrium, and that all is well in the world. Only those who accept the inherent wildness of markets will recognize the power of Theory 144 to reveal the order beneath the fantasy of random chaos in market prices.
David Knox Barker is a long wave analyst, technical market analyst, world-systems analyst and author of Jubilee on Wall Street; An Optimistic Look at the Global Financial Crash, Updated and Expanded Edition (2009). He is the founder of LongWaveDynamics.com, and the publisher and editor of The Long Wave Dynamics Letter and the LWD Weekly Update Blog. Barker has studied and researched the Kondratieff long wave “Jubilee” cycle for over 25 years. He is one of the world’s foremost experts on the economic long wave. Barker was also founder and CEO for ten years from 1997 to 2007 of a successful life sciences research and marketing services company, serving a majority of the top 20 global life science companies. Barker holds a bachelor’s degree in finance and a master’s degree in political science. He enjoys reading, running and discussing big ideas with family and friends.
© 2010 Copyright David Knox Barker - All Rights Reserved Disclaimer: The above is a matter of opinion provided for general information purposes only and is not intended as investment advice. Information and analysis above are derived from sources and utilising methods believed to be reliable, but we cannot accept responsibility for any losses you may incur as a result of this analysis. Individuals should consult with their personal financial advisors.
© 2005-2022 http://www.MarketOracle.co.uk - The Market Oracle is a FREE Daily Financial Markets Analysis & Forecasting online publication.