


Gold and Silver to the moon and precious metal shares into outer space
Commodities / Gold and Silver 2010 Sep 13, 2010 - 07:20 AM GMTBy: Ronald_Rosen

Sure, sure, gold and silver to the moon and precious metal shares into outer space… This news is all over the internet and on a multitude of T.V. advertisements.
However, if in the meantime you want to keep from losing your shirt, read on and study the chart posted below.
When you are finished and you want to know when the bottom may arrive you can join my crew. We plan on getting in at the bottom, not the top.
YOU WILL FIND VALUABLE INFORMATION ABOUT SILVER,
GOLD, AND THE HUI AS A SUBSCRIBER TO:
THE ROSEN MARKET TIMING LETTER
www.wilder-concepts.com/rosenletter.aspx
Changes in stock prices are not simply a tug of war between supply and demand but also reflect human opinions, valuations, and expectations.
A study carried out by mathematical psychologist Vladimir Lefebvre demonstrated that humans exhibit positive and negative evaluations of the opinions they hold in a ratio that approaches phi, with 61.8% positive and 38.2% negative and that Fibonacci numbers are rooted in a trader's psychology.
Predicting Market Movements with Fibonacci Numbers
Research shows markets as being perfectly patterned, explaining that humans, being part of nature, create perfect geometric relationships in their behaviors, even if they don't realize it themselves.The Golden Mean is the number 0.618. In Both Greek and Egyptian cultures, this number was highly significant. They believed that the number had important implications in many areas of science and art. This dimension was utilized in the construction of many buildings - including the pyramids.
The Golden Mean appears frequently enough in the timing of highs and lows and price resistance points that adding this tool to technical analysis of the markets can help to identify key turning points. The Fibonacci numbers sequence and the golden ratio have fascinated mathematicians for hundreds of years. While Fibonacci numbers have many applications, they have received considerable interest from traders due to their uncanny accuracy in spotting market turning points in advance.
You can use Fibonacci numbers as a predictive tool and when used correctly they can enhance your analysis of the market, helping you to increase profits and decrease risk.
The Fibonacci number Sequence
The resulting Fibonacci numbers 1, 1, 2, 3, 5, 8, 13, 21, 34, 55, 89, are the result of the following equation.
The ratio of any number to the next larger number is 62%, which is a popular Fibonacci retracement number. The inverse of 62% is 38%, and this 38% is likewise a Fibonacci retracement number.”
==============================================================================================================================
Fibonacci numbers 1, 1, 2, 3, 5, 8, 13, 21, 34, 55, 89
“A study carried out by mathematical psychologist Vladimir Lefebvre demonstrated that humans exhibit positive and negative evaluations of the opinions they hold in a ratio that approaches phi, with 61.8% positive and 38.2% negative and that Fibonacci numbers are rooted in a trader's psychology.” Ezine @rticles
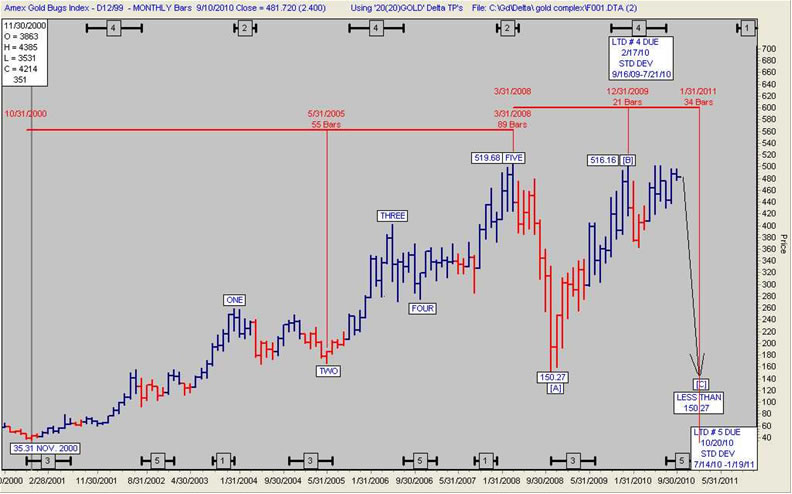
The monthly chart of the HUI is excellent proof of Vladimir Lefebvre’s statement that “Fibonacci numbers are rooted in a trader's psychology.” Fibonacci numbers are found throughout the entire bull market in the HUI. There are five waves up that consumed 89 months of time. The correction of the five wave bull move that consumed 89 months should last 38.2% of 89 months which is 34 months and have a configuration of three waves. When the correction is complete there will have been eight waves. In (Fibonacci) summary, we have 5 waves up, 3 waves down, an 89 month bull move, a potential 34 month bear market correction, and a ratio of 61.8% bull move to 38.2% bear move. Of great importance is that the Fibonacci turns take place at Delta Long Term Turning points. The potential benefits of this analysis do not stop here. Think gold and silver bullion and then an open invitation is extended to one and all to join my crew.
HUI MONTHLY
Subscriptions to the Rosen Market Timing Letter with the Delta Turning Points for gold, silver, stock indices, dollar index, crude oil and many other items are available at: www.wilder-concepts.com/rosenletter.aspx
By Ron Rosen
M I G H T Y I N S P I R I T


Ronald L. Rosen served in the U.S.Navy, with two combat tours Korean War. He later graduated from New York University and became a Registered Representative, stock and commodity broker with Carl M. Loeb, Rhodes & Co. and then Carter, Berlind and Weill. He retired to become private investor and is a director of the Delta Society International
Disclaimer: The contents of this letter represent the opinions of Ronald L. Rosen and Alistair Gilbert Nothing contained herein is intended as investment advice or recommendations for specific investment decisions, and you should not rely on it as such. Ronald L. Rosen and Alistair Gilbert are not registered investment advisors. Information and analysis above are derived from sources and using methods believed to be reliable, but Ronald L. Rosen and Alistair Gilbert cannot accept responsibility for any trading losses you may incur as a result of your reliance on this analysis and will not be held liable for the consequence of reliance upon any opinion or statement contained herein or any omission. Individuals should consult with their broker and personal financial advisors before engaging in any trading activities. Do your own due diligence regarding personal investment decisions.
Ronald Rosen Archive |
© 2005-2022 http://www.MarketOracle.co.uk - The Market Oracle is a FREE Daily Financial Markets Analysis & Forecasting online publication.