


Gold forms Overbought Rising Wedge at Resistance
Commodities / Gold and Silver 2010 Sep 13, 2010 - 03:13 AM GMTBy: Chris_Vermeulen

 Precious metals soar as investors flock to gold and silver. But are they looking deep enough to truly understand the current trends at hand?
When reviewing the metals sector I like to look at it from different angles to get a solid understanding of the patterns and trend forming. I follow multiple time frames along with monitoring the gold mining stocks. Gold stocks tend to lead the price of gold bullion and when its out performing the price of gold substantially by 10% or more you should be expecting a pause or pullback in both gold stocks and gold bullion prices temporarily.
Below are a few charts showing the long and short term trends for gold.
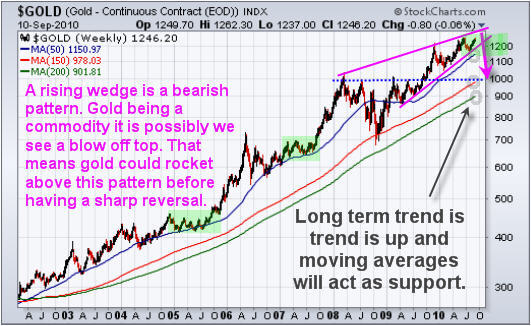
Gold Bullion Price – Weekly Trend Chart
Gold continues to be in a strong up trend. The occasional test of support at the major moving averages can provide great long term points for adding to a position. The 50 period average is one which is tested frequently.
Looking at the weekly chart does give me a red flag for the intermediate price of gold. While the trend is clearly up I can’t help but notice the rising wedge which is a bearish pattern. During an uptrend we want to see bull flags and pennants, not a grind higher forming a narrowing range. This grind higher could unfold much similar to the price action of 2005 and 2007 instead of a correction but I am leaning more towards a sharp correction because more people are bullish on gold now then they were during the June top.
For those looking at gold as a long term investment/currency can be patient and wait for a pullback to a major moving average before adding to your position then you would lower your overall risk for this position. You will understand after reviewing the following charts.
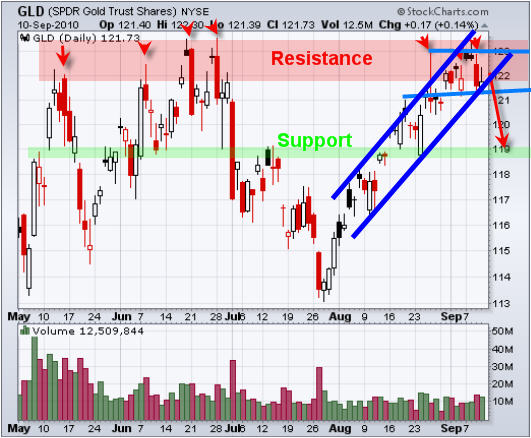
GLD – Gold Bullion ETF – Daily Chart
(This fund moves identical to spot gold price so even though I am showing you GLD fund, the spot gold chart is doing the exact same thing.) As you can see below the price of gold is trading at resistance and becoming choppy. Buying gold at resistance does not make much sense to me. There is a very good chance gold will move lower in the coming weeks providing a better price for long term investors to add to their positions. For example, if you waited for the weekly chart to pullback to the 50 period moving average that would be like buying this GLD fund at $113, which is an 8% discount.
Gold continues to hold up within its channel but this week we could see fireworks if the price breaks below the blue support channels.
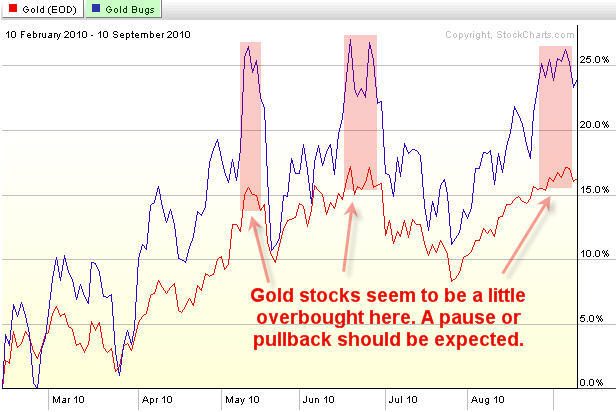
Gold:Gold Stocks Comparison – Daily Chart
This chart shows the performance of gold vs gold stocks from the Feb 2010 lows. The blue line is the performance of gold stocks while the red line shows gold’s performance. It’s obvious that when everyone is bullish on gold they buy the highly leverages gold investments in order to take full advantage of the upcoming move. This is much like reading the put/call ratio for trading the SP500 and it measures the bullishness of the precious metals sector.
When gold equities are strongly out performing gold bullion you should be thinking about raising your stops, taking partial profits and or hedging your long term position until the sector stabilizes is not trading at a premium.
Precious Metals Sector Trading Conclusion:
In short, Gold is in a strong up trend and will remain in one for a long time. Commodities have higher percentage of going parabolic. That means there’s a small chance that gold continues to move up quicker and quicker surging hundreds of dollars in a very short period of time. That being said, it’s not very likely, and from a technical point of view those buying gold now are paying a premium in my opinion.
Being a patient trader is not easy, but waiting for low risk entry points is very rewarding on many different levels when done correctly.
If you would like to receive my Trading Analysis and Signals Complete with Entry, Targets and Protective Stops please visit my website at: www.TheGoldAndOilGuy.com
By Chris Vermeulen
Chris@TheGoldAndOilGuy.com
Please visit my website for more information. http://www.TheGoldAndOilGuy.com
Chris Vermeulen is Founder of the popular trading site TheGoldAndOilGuy.com. There he shares his highly successful, low-risk trading method. For 6 years Chris has been a leader in teaching others to skillfully trade in gold, oil, and silver in both bull and bear markets. Subscribers to his service depend on Chris' uniquely consistent investment opportunities that carry exceptionally low risk and high return.
This article is intended solely for information purposes. The opinions are those of the author only. Please conduct further research and consult your financial advisor before making any investment/trading decision. No responsibility can be accepted for losses that may result as a consequence of trading on the basis of this analysis.
Chris Vermeulen Archive |
© 2005-2022 http://www.MarketOracle.co.uk - The Market Oracle is a FREE Daily Financial Markets Analysis & Forecasting online publication.