


The Stock Market VIX Indicator to Gauge and Profit from the Market’s Mood
Stock-Markets / Volatility Sep 12, 2010 - 10:10 AM GMTBy: Investment_U

 Karim Rahemtulla writes: After you’ve read this article, the next time someone asks you, “Hey, how’s the market looking?” you’ll know what to say – and sound smart saying it!
Not only that, the information I’m about to share with you will also give you a valuable clue as to when to buy and sell your stocks.
In their columns this week, my colleagues, Alexander Green and Marc Lichtenfeld, talked about the importance of tuning out the media “noise” and constant flow of bad news. Instead, they advised that you pay attention to real indicators like earnings (which are good) and investor sentiment (which is bad).
And that doesn’t mean taking your cue from other investors and blindly following them. Quite the opposite, in fact. We continue to underline the importance of having contrarian instincts when it comes to investing.
But how can you tell what investors are feeling and the general mood of the market? Simple…
The Best Way to Gauge Investor Behavior
The CBOE Volatility Index (^VIX) is a measure of market sentiment, based on options trading among the S&P 500 companies.
In short, if more people are buying put options than call options, they’re betting that the market will head lower. As a result, the VIX will rise, indicating fear in the marketplace.
Conversely, if more investors are buying calls than puts, they’re predicting that the market will head higher and the VIX will fall amid perceived investor complacency.
As you can see below, the VIX and market volatility were trending higher a few weeks ago. But you can also see that the rise in volatility wasn’t nearly as pronounced as it was in May after the infamous “flash crash.”
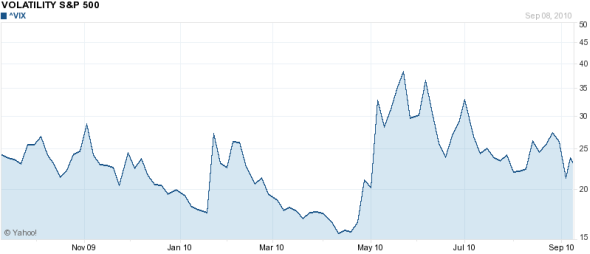
More recently, the VIX hasn’t confirmed the S&P 500′s move from the 1,100 level down to the 1,040 level. And as it stands now, the VIX is about 40% lower than it was when it spiked to 37.58 on July 1.
Translation?
Are You Watching the “Head-and-Shoulders?”
Basically, there’s an underlying bullish sentiment in the market. For evidence, the S&P 500 recently set what technical analysts call a “head-and-shoulders” pattern – a very bearish signal for the market. But the VIX didn’t confirm this pattern and, lo and behold, the market rallied again.
Head-and-Shoulders Pattern
As the name suggests, this is a chart pattern that bears resemblance to a person’s head and shoulders.
You can spot the pattern easily, as it will show two lower peaks (the shoulders) either side of a higher one (the head).
It’s marked by the price first rising to a peak before declining, thus setting the first “shoulder.” The price then rises again, above the first peak, which establishes the “head.” The price then falls again. The final step – i.e. the second “shoulder” is another rise in price to roughly the same level as the first “shoulder.”
Here’s what to watch for next…
Interpreting the VIX: When to Buy and Sell Your Stocks
Right now, the VIX is trending lower. This is important because if it continues in that direction – and into the mid to upper teens – you’ll want to buy the VIX. Why?
Because each time the VIX has traded in the mid teens, it’s represented a major opportunity to short the market, since that level has historically proved to be the bottom of the volatility range.
And that range – if we ignore only the most extreme bullish and bearish events as aberrations – is between 13 and 49.
~ At 13: This means investors are very complacent. You should buy the VIX and sell stocks.
~ At 49-Plus: This means investors are panicking. You should sell the VIX and buy stocks.
Take the Market’s Pulse Every Day
Now do yourself a favor…
If you’re not tracking the VIX, do it. Just add the ticker symbol to your list. While there is no 100% accurate way of predicting what the market will do, it certainly pays to have indicators that can help you gauge investors’ moods and the market climate.
The VIX is my favorite way of doing so and it’s proved to be the most reliable indicator of the market’s future moves over a short period of time.
Good investing,
Source: http://www.investmentu.com/2010/September/index-to-gauge-markets-mood.html#more-16316
Karim Rahemtulla
P.S. There is an ETN that follows the VIX – the iPath S&P VIX Short-Term Futures (NYSE: VXX). However, it doesn’t follow the VIX exactly and suffers from “leakage” – i.e. because of the costs associated with trading VIX futures, the fund leaks capital each month. Basically, it will give you about 60% of the VIX’s underlying moves. So if the VIX moves up 10 points, VXX will rise about six points.
Copyright © 1999 - 2008 by The Oxford Club, L.L.C All Rights Reserved. Protected by copyright laws of the United States and international treaties. Any reproduction, copying, or redistribution (electronic or otherwise, including on the world wide web), of content from this website, in whole or in part, is strictly prohibited without the express written permission of Investment U, Attn: Member Services , 105 West Monument Street, Baltimore, MD 21201 Email: CustomerService@InvestmentU.com
Disclaimer: Investment U Disclaimer: Nothing published by Investment U should be considered personalized investment advice. Although our employees may answer your general customer service questions, they are not licensed under securities laws to address your particular investment situation. No communication by our employees to you should be deemed as personalized investment advice. We expressly forbid our writers from having a financial interest in any security recommended to our readers. All of our employees and agents must wait 24 hours after on-line publication or 72 hours after the mailing of printed-only publication prior to following an initial recommendation. Any investments recommended by Investment U should be made only after consulting with your investment advisor and only after reviewing the prospectus or financial statements of the company.
Investment U Archive |
© 2005-2022 http://www.MarketOracle.co.uk - The Market Oracle is a FREE Daily Financial Markets Analysis & Forecasting online publication.