Behold! A New Stock Market Chart Pattern to Consider
Stock-Markets / Stock Markets 2010 Sep 10, 2010 - 03:18 PM GMTBy: Barry_M_Ferguson
 To those of us who consider ourselves 'technical analysts', we are always perusing charts for known patterns to help forecast trend lines. Our world is limited to a relatively few established patterns that have been studied for centuries. However, we must all understand that economies change, markets change, and primary market influences change. It follows that technical patterns should also change and expand.
For instance, our central banks have now decided (in earnest since 2003) that the equity markets are their domain and as such, now dominate equity trading in an effort to stimulate economies towards growth. Clearly since the March lows of 2009, the Fed and the PPT have assumed complete control of the equity market. Almost as if the line in the movie 'Rocky' muttered from Apollo Creed to Rocky at the end of the climactic fight, "Ain't gonna be no re-match” has come to life, the Fed has thrown down the gauntlet to say, 'Ain't gonna go back to Dow 6,500'. Indeed we won't. All we need is money and a trading account as provided by the Working Group on Financial Markets. Of late, the PPT has made it quite clear that Dow 10,000 will be defended with every ounce of ink they can muster. Reality no longer matters. Neither do fundamentals. If the Dow drops below 10k, lookout! Here comes a buy program that is fast, concentrated, and directed right at anyone contemplating a sale of any equity.
So for this week (ending September 10, 2010), we have confirmation that the PPT rally ignited by the worst August in 10 years is going to hold. Now, how do we know? First, we must identify the rally pattern. I won't rehash all the economic news but suffice to say that almost all of it is bad. The media and Wall Street spin is that none of the bad news was as bad as 'expected' or as bad as it 'could have been'. Yes, even the Fed minutes told us the economy was slowing even more and unemployment would remain high forever. Nevermind. The Dow is now the modern barometer of economic strength. Regardless of slow economics, high unemployment, bankruptcies on every street, real estate depression, and debt that can never be repaid, we have a stock index rally. Like I said, 'all you need is a lot of money and a trading account'. So, the first sign of the new chart pattern is a horrible economic backdrop yet coordinated with a strong index rally.
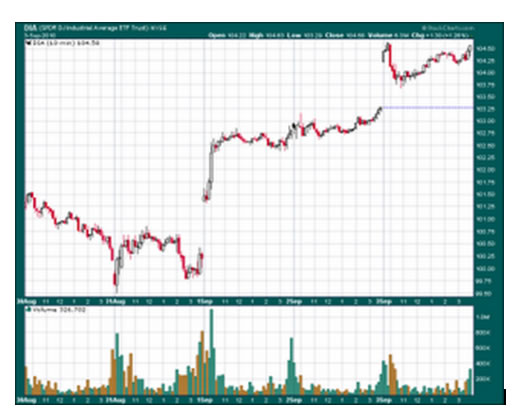
The second sign of this new pattern can best be explained by looking at the charts. Chart 1 is a 10-minute intraday, 5-day chart of the DIA for the period August 30, 2010 through September 3, 2010. The PPT has obviously opted to shift from their prior strategy of waiting until 3:30PM to engineer one of those miraculous 200-point, surging to the close rallies to a strategy of bullying the sellers and short sellers at the open of trading. The change in strategy is most likely due to the fact that after years of manipulation of market indices at the end of the day, the impulse to sell has not terminated. After all, if all the sellers went away, the indices would have a natural tendency to rise thus fooling the sheople into believing all was economically well. The trick is to eliminate the sellers and short sellers. The PPT buy programs at the end of the day were impressive but the sellers would invariably be waiting to resume selling at the opening the next morning. Given all their Herculean efforts over the past few years, it would seem obvious that the late day rallies have done nothing to curb selling. So we now have a change in strategy.
The new strategy is to blast the indices higher right from the opening moments of trading. This does several things. First, no matter what horrible economic news has been announced, market indices blasting higher at the open of trading corroborates the idea that the 'news' could have been worse. Sense it's not even worse, ergo, it is therefore 'better'. See, we are already into the manipulation of psyche. Second, the burst at the opening brings cheer to traders for the day. The momentum is rising. Traders like that. Third, the threat of a late day rally is still there. Should sellers and short sellers choose to attack after the PPT jacks the indices higher in the morning, they must worry that the PPT will be back in the afternoon to finish them off. Let's look at Chart 1.

Chart 1. DIA - Intraday, 10-min bars, Aug. 30 - Sept. 3
Chart courtesy StockCharts.com
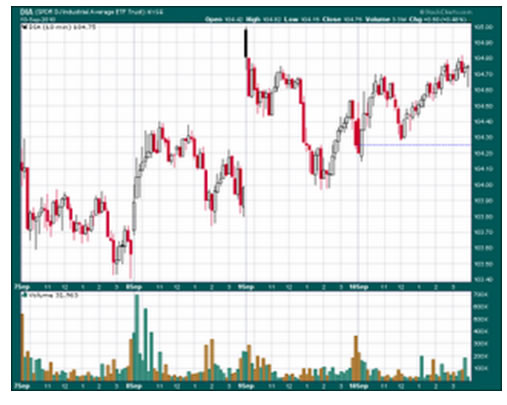
From Chart 1, we must understand the 'womb of the rally'. The last six trading days of August each flirted with Dow 10,000 and below. Remember, this was the worst month of August since 2001. The Fed knows that investors will soon be getting their monthly statements in the mail and will likely be spooked by what they see. What they see on the statements will no doubt confirm what they see all around them with bankruptcies, foreclosures, and empty retail space. In addition, the month of September is statistically the worst month of the year for the stock indexes. Worry not my friends! To keep the Fed scam going, the PPT no doubt went into high gear immediately blasting the Dow higher from the first day of the worst month of the year. And of course, the new zero is Dow 10,000. The PPT will fight this level with everything they have. So up we went. But look at the chart. Each day was defined by about 20 minutes of straight up buying followed by muddling directionless trading. If needed, the PPT pumped in a booster shot at the end of the day. This action struck fear in sellers and they went away. So we now have a new trading pattern to consider. I think we should call this one the 'Fornicating Fed' pattern. It is pure manipulation (that used to be illegal) coordinated with shill banks (insider information still is illegal) and ignored by the media (not really 'media' as much as market cheerleaders). This pattern is identified with its ferocious 10-minute 'flash burst' buying gapping the trade generally at the beginning of the day. Generally this strong up trade should be accompanied by horrendous economic news like 'existing home sales were the worst in 40 years'. The 'flash crash' got a lot of attention but in the end, the Dow was only down 360 or so points on the day. The first 3 days of September saw the Dow rise 454 points with horrible economic news and no one said a word! So let's look at this week's trading and see if we see the pattern continue. Look at Chart 2

Chart 2. DIA - 10-min bar intraday from Sept. 7, 2010 through Sept. 10, 2010
Chart courtesy StockCharts.com
Well, Monday was Labor Day so on Tuesday, we saw the Dow lose over 100 points. After all that hard work on the part of the PPT! The nerve of sellers who hit the index with a high volume sell attack! Well, you know what that means? This is war and the PPT has more money than all of us. Pow! Straight up we went on Wednesday right out of the block. The 'Fornicating Fed' is still with us. Thursday? Pow! Straight up at the opening. And now Friday? Let me just tell you that Thursday saw the Dow lose some 30 points of its rally in the final 30 minutes of trading. Now, what do think would happen on Friday morning? The 'Fornicating Fed'! Indeed. There it was. Another rally right at the open of trading. Would it hold?
Beyond my perverse sense of humor, why now does the Fed/ PPT defend the Dow 10,000 level and create the new chart pattern, the 'Fornicating Fed'? Very simply, the Fed/ PPT are now themselves very astute chart followers. Dow 10,000 is very clearly the neckline in a long and sloppy head and shoulders pattern that would imply downside risk to at least Dow 9,000 or a bit lower should it be broken. Given the horrendous nature of the economy, er, ah, I mean, 'recovery', falling stock indexes would likely add fuel to the fire that we are all in deep debt crap with no way out. Now all we have to do is pray everyday that 'please Mr. Bernanke, don't abandon us now'. Put some money into the Dow at the end of the day and watch the magical manipulator of markets matriculate money to the moon!
Oh, just one minor warning. The volume of trading on the DIA has been waning since the late August blast from the PPT. In fact, today's (Friday) trading volume was about one-third of the average trading volume. Friday's total volume was only 3 times the volume of Wednesday morning's 10 minutes of opening rally volume! Generally, that's not a good thing. Oh well - hopefully the PPT will be up bright and early on Monday morning!
Well, just one more thing. I don't know that it means anything but the Dow Real Estate sector (IYR) is way out-performing the Dow and the semiconductor index (SOX) is way under-performing the Dow year-to-date. What we can surmise is the sectors that lose money do well and the sectors that make money do poorly. That's healthy. But in the end, we all know who owns the real estate. It's the banks! Hooray! Everything for the big banks! Sis - boom - baa!
Barry M. Ferguson, RFC
BMF Investments, Inc.
www.bmfinvest.com
Publisher of Barry's Bulls newsletter - Subscriptions at $120/yr 12 issues
Advisory services offered through BMF Investments, Inc
© 2010 Copyright © 2010 Copyright Barry M. Ferguson - All Rights Reserved
Disclaimer: The views discussed in this article are solely the opinion of the writer and have been presented for educational purposes. They are not meant to serve as individual investment advice and should not be taken as such. This is not a solicitation to buy or sell anything. Readers should consult their registered financial representative to determine the suitability of any investment strategies undertaken or implemented.
© 2005-2022 http://www.MarketOracle.co.uk - The Market Oracle is a FREE Daily Financial Markets Analysis & Forecasting online publication.


