


What Do You Need To See To Take A Trade
Companies / Company Chart Analysis Sep 08, 2010 - 08:39 AM GMTBy: David_Grandey

 Summer is over and it’s time to get serious — serious in the sense of reviewing YOUR GOALS. A question we find ourselves asking right here is:
What is it going to take for me to earn another 10% return on the overall portfolio from here by year end?
Quick! Look at the total value of your portfolio right now. Write that number down and ask yourself WHAT IS IS GOING TO TAKE for me to accomplish another 10% return to the total value of my overall portfolio WITHOUT killing myself and by employing proper risk management. By the way proper risk management means not shooting for the hills.
And here is another catch, that being REGARDLESS of what the market does. What if the market goes nowhere between now and year end? Have you factored that into your plan? We have.
Remember around here we do not employ what 90% of traditional wall street does via a cookie cutter indexing money management style such as: As the market goes so goes your account because all one has to do is buy an index fund and be done with it.
This is why those who trade in tandem with us are up 64% over two years and up 20% year to date while never being much more than 50% invested. How does that compare to traditional wall street’s model of being 100% invested and at the mercy of the market?
Don’t get us wrong, we’re not slamming ALL of traditional wall street, just 90% of them. We know a lot of great managers, some even subscribe to our services.
It all comes down to “WHAT DO I NEED TO SEE TO MAKE ME TAKE A TRADE”
As far as putting NEW money to work on the long side here, it’s all about issues that are above the 50 day average that are building out Pullbacks Off Highs (POH) long side patterns.
Let’s take a look at some charts:
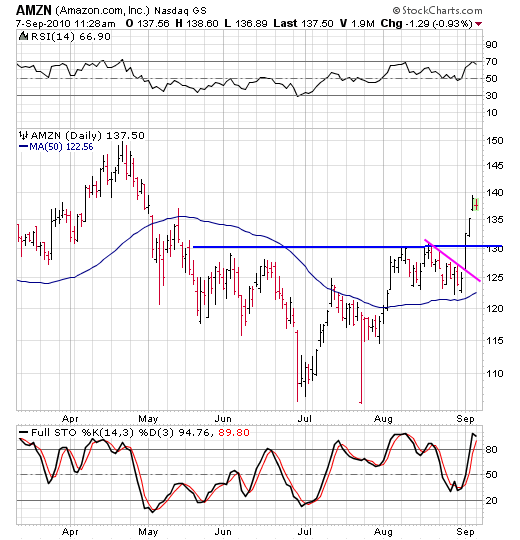
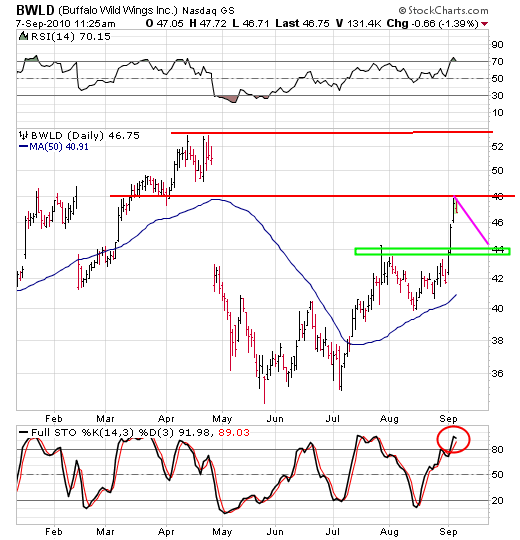
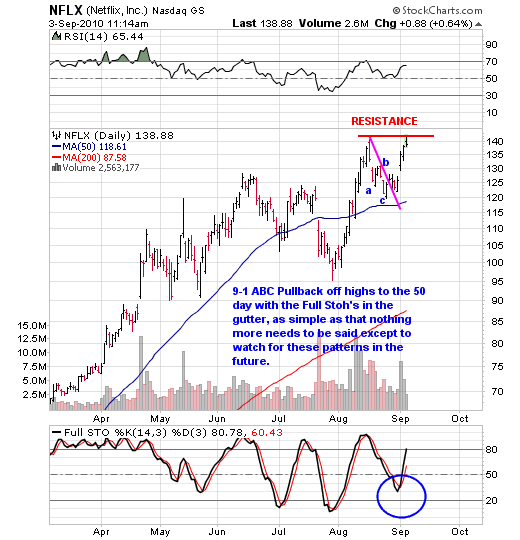
That Pink Line Pullback Off Highs (POH) pattern was textbook! Then the upside crossover of the blue line was the 2nd lowest risk entry point. Now? Forget about it. We need to see a pullback to the blue line or some sort of POH develop here to get us interested on the long side. Follow Through Day or not, it’s what we need to see. Same goes for BWLD below.
This is exactly what we saw with NFLX. The result?
122 to 140 in 4 days!
By David Grandey
www.allabouttrends.net
To learn more, sign up for our free newsletter and receive our free report -- "How To Outperform 90% Of Wall Street With Just $500 A Week."
David Grandey is the founder of All About Trends, an email newsletter service revealing stocks in ideal set-ups offering potential significant short-term gains. A successful canslim-based stock market investor for the past 10 years, he has worked for Meriwest Credit Union Silicon Valley Bank, helping to establish brand awareness and credibility through feature editorial coverage in leading national and local news media.
© 2010 Copyright David Grandey- All Rights Reserved Disclaimer: The above is a matter of opinion provided for general information purposes only and is not intended as investment advice. Information and analysis above are derived from sources and utilising methods believed to be reliable, but we cannot accept responsibility for any losses you may incur as a result of this analysis. Individuals should consult with their personal financial advisors.
© 2005-2022 http://www.MarketOracle.co.uk - The Market Oracle is a FREE Daily Financial Markets Analysis & Forecasting online publication.