


The U.S. Unreal Real Estate Market
Housing-Market / US Housing Sep 06, 2010 - 02:47 PM GMTBy: Mark_B_Rasmussen

 The peak was 60 - 61 months ago. The historical peak to trough real estate prices is 46+ months. 01/10 was the low for the 4.5 yr. decline that began in the summer of 2005.
Foreclosures for Washoe County:
2006 69
2007 779
2008 2,194
2009 3,623
Foreclosures 300 for Washoe Country were down 26.7% from 08/2009.
Notices of default 682 were down 36% from 08/09. NOD’S have exceeded MLS sales for 35 consecutive months. Many of the large number of defaults will be added to Real Estate inventory with a 4 - 5 month lag time (Foreclosure process).
41.4% of notices of default for 04/10 (4 months) ended in foreclosure last month.
Unsold inventory in the Reno/Sparks MLS is 4.8 months, a 63% increase over 03/10.
REO’S and short sales represent 52.7% of listings, 57.8% of sales (08/2010), and 85.6% of pending sales. No one can sell for less than a lender.
Reno/Sparks has the highest unemployment in the U.S. (14.3%) which has increased since the beginning of the year and has the highest default rate in the U.S. (16%).
The National Picture
The following is the most recent national housing data and the result after 6 unprecedented rescue programs and record low interest rates.
The National Association of Realtors said sales dropped a record 27.2 percent from June to an annual rate of 3.83 million units, the lowest level since May 1995. June's sales pace was revised down to a 5.26 million-unit pace.
New Home Sales fell 12.4 percent in July versus June, the slowest sales pace since records started in 1963, and the past three months sales were the worst ever on record.
The number of months it would take to sell the current supply of homes also swelled in July to 12.5, which was a huge jump compared to June's rate of 8.9. It's also nearly double November's rate of 6.5. Given the low rate of sales this summer and consistently high foreclosure rate, inventory will likely continue to grow.
Sales by region: Sales fell the most in the West, where they decreased by more than 25%; the Northeast saw sales decline by 13.9. Sales in the South and Midwest declined by just over 8%.
The Commerce Department said median sales price of $210,100, was down 11.5 percent from $237,300 a year earlier.
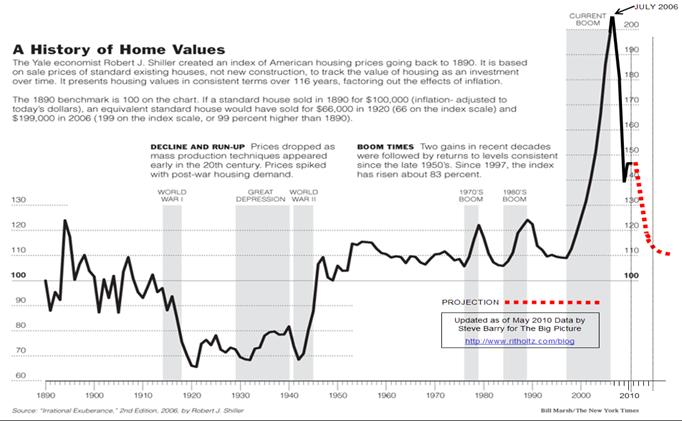
The popular S&P/Case-Shiller 20-City Index says that U.S. home prices fell 33% from mid-2006 to April of this year. This is the biggest decline in home prices in the U.S. on record. To give you an idea of the magnitude of the fall in prices, during the Great Depression, home prices fell only 15% in the U.S.
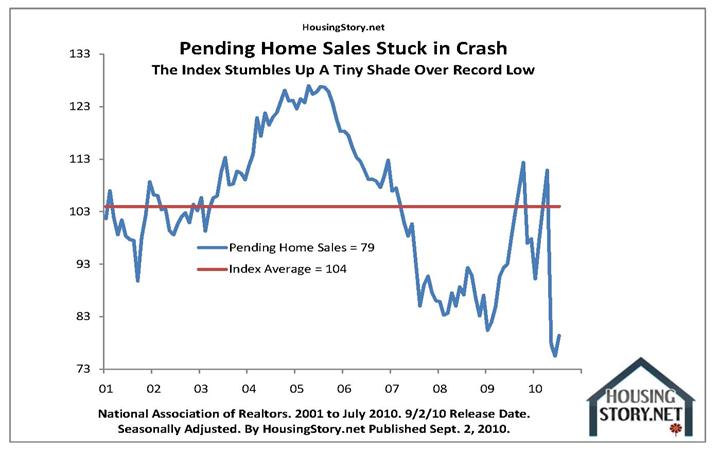
Home sales had soared in March and April as homebuyers rushed to sign contracts ahead of the April 30 deadline for the $8,000 tax credit. But sales plummeted in May, the first month after the incentive expired, to an annual rate of 281,000. The pace only improved modestly in June. Here, the government squanders huge amounts of money to bring future demand into the present, ensuring an ensuing collapse or eternal dependence on subsidy and support at tax payer expense. This is not capitalism or a free market.
Plunging Purchases – the spike was the government intervention first time homebuyer tax credit. This is not Capitalism or free market and always ends in predictable fashion.
Last month nearly fell off of the chart….look closely.
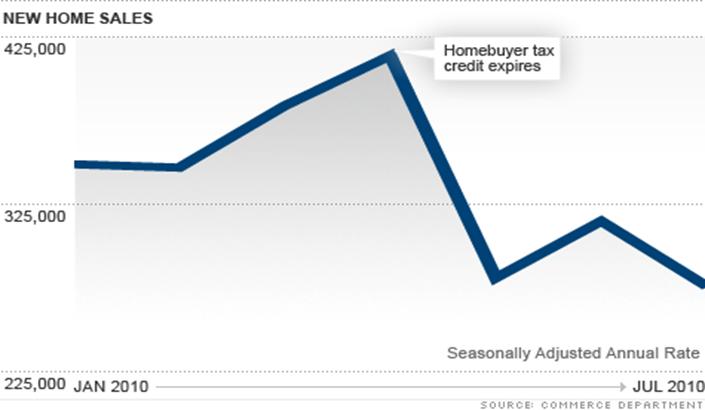
New home sales drop 12.4% to record low
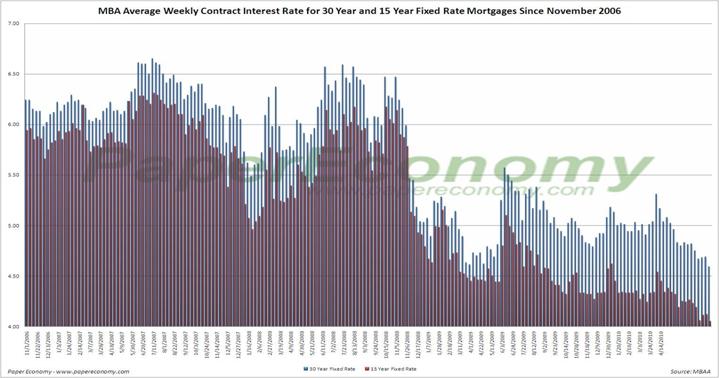
Record low interest rates
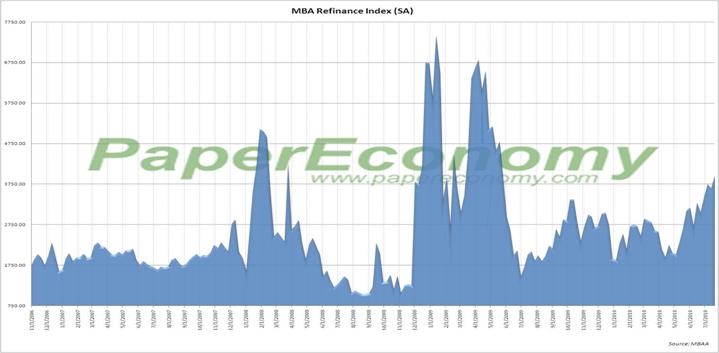
Refinance – impaired by equity and credit
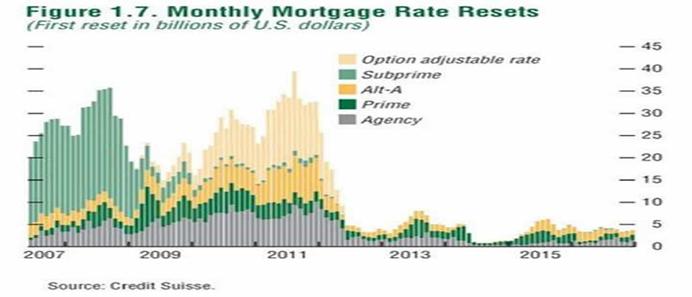
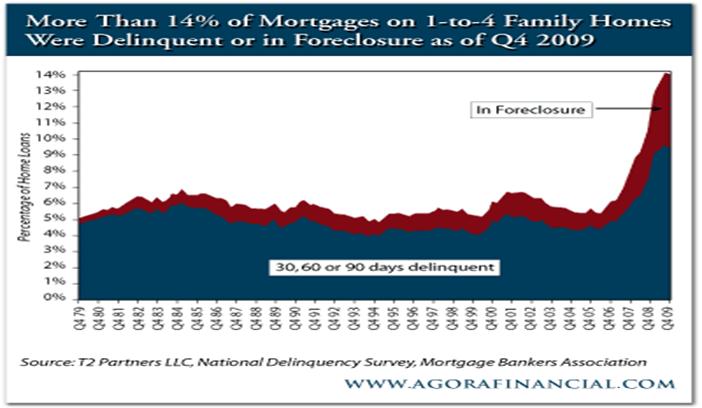
Shadow Inventory includes homes that are usually several months in arrears on their mortgage and about to hit the foreclosure circuit; homes that are 90-plus days delinquent and currently languishing in foreclosure; or bank-owned (REOs) that have not yet been put on the market. But come on the market they will, one way or the other, and at greatly discounted prices – distressed or short sales. Rick Sharga, senior vice president at RealtyTrac, an online market for distressed homes said "Theoretically you could say up to 7 million homes are in the pipeline, but not all of them will go to the market and if even if they do, not all of them will hit at once,"
Vacant homes stand at 19 million for Q2 2010 according to the U.S. Census Bureau. There are an estimated 128 million homes in the USA so almost 15% today stand vacant.
Demographics - Baby boomers - between 1944 –1964 began retiring in 2006. 78 million are expected to retire over the next 10 years. Their biggest asset is typically real estate with a tendency to downsize the empty nest.
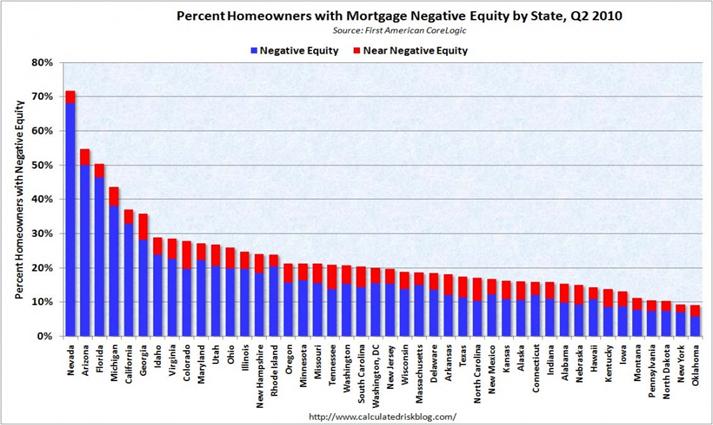
Latent Inventory - Millions of Americans accumulated real estate during the halcyon (bubble days) and before and are patiently waiting for the opportunity to liquidate many properties at better prices than exist today. When real estate prices recover, many owners will put some of this latent inventory on the market. A seller typically needs at least 10% equity to break even when selling a property, so, millions of underwater (negative equity) properties will become available when values begin to recover. This will have the affect of holding down prices.
Commercial Property and how business works.
Of the $1.4 trillion of commercial-real-estate debt coming due by the end of 2014, roughly 52% is attached to properties that are underwater, according to debt-analysis company Trepp LLC. And as the economic recovery sputters, owners of struggling properties are realizing a big property-value rebound isn't imminent.
Indeed, investors are rewarding public companies for ditching profit-draining investments. Deutsche Bank AG's RREEF, which manages $56 billion in real-estate investments, now favors companies that jettison cash-draining properties with nonrecourse debt, loans that don't allow banks to hold landlords personally responsible if they default. The theory is that those companies fare better by diverting money to shareholders or more lucrative projects.
In one recent CMBS default, Vornado, one of the country's largest owners of offices and malls, stopped payments on an $18 million mortgage on the Cannery at Del Monte Square mixed-use development in San Francisco. Simon Property Group last year also walked away from the struggling Palm Beach Mall in West Palm Beach, Fla. And Macerich in July forfeited Dallas's Valley View Center mall, which was saddled with a $135 million mortgage. Stopping the bleeding is a necessary part of survival.
Consumer residential property from the “Double Standard Chronicles”.
Banking-industry officials and others have argued that homeowners have a moral obligation to pay their debts even when it seems to make good business sense to default (this “moral obligation” problem apparently doesn’t exist in the business world). Owners lose all of their down payment first and the lender (rescued by the owner/tax payer) loses part of their investment and is given free money by the government and Fed to mitigate the losses. Individuals who walk away from their homes also face blemishes to their credit ratings and, in some states (Nevada), creditors can sue them for the losses they suffer.
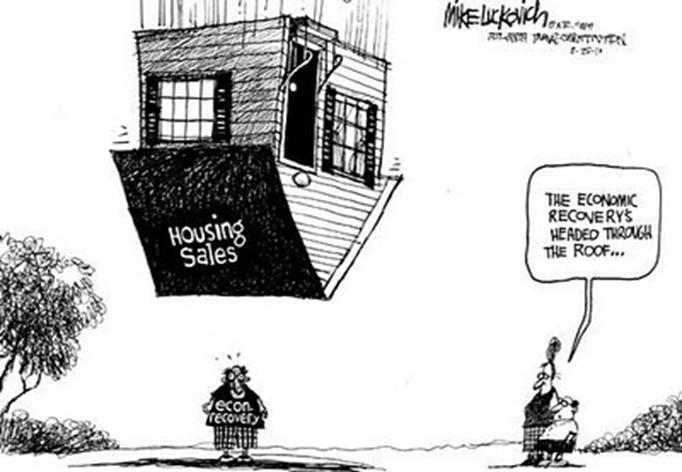
WELCOME TO THE “SUMMER OF RECOVERY”!!!
By Mark B. Rasmussen
Mark is a real estate appraiser/broker by profession
Copyright © 2010 Mark B. Rasmussen
Disclaimer: The above is a matter of opinion provided for general information purposes only and is not intended as investment advice. Information and analysis above are derived from sources and utilising methods believed to be reliable, but we cannot accept responsibility for any losses you may incur as a result of this analysis. Individuals should consult with their personal financial advisors.
© 2005-2022 http://www.MarketOracle.co.uk - The Market Oracle is a FREE Daily Financial Markets Analysis & Forecasting online publication.