


Learn How to Create Synthetic SPX Equity Positions Using Options
InvestorEducation / Options & Warrants Sep 04, 2010 - 05:36 AM GMTBy: J_W_Jones

 For most equity traders, the S&P and/or the Dow are watched quite closely. While these indices are usually just as important to option traders, the volatility index is generally closely monitored as well. There are a variety of volatility indices to watch, but most traders look at the S&P volatility index which is commonly referred to as "The VIX."
I spend a lot of time watching the S&P E-mini's as well as watching the VIX. Recently I have been using a variation of what most option traders call synthetic stock positions. Through the use of options, a competent trader can sustain similar returns with far less capital than what would be required to own the stock outright, even if the equity trader was using a margin account.
The traditional structure of a synthetic long stock position involves buying a call and selling a put at the same strike price and expiration date. If an option trader is leaning long, he/she would buy a call and sell the put, likewise if the option trader is leaning short then the put is purchased and the call is sold. Typically, the trade utilizes options that are near-the-money or slightly in-the money.
For those who remember high school algebra, the mathematical expression of this relationship is S=C-P. The variables are defined as S=stock, C=call, and P=put. Using tenth grade algebraic rearrangements of this equation, the various equivalency relationships can easily be determined.
Before I go any further, naysayers will point out that selling a naked call offers unlimited risk to an option trader as stocks theoretically can rise to infinity. It is true, the naked call position is extremely risky and a naked put position carries significant risk as well, but alas, there are ways to mitigate that risk. So before you start crying about how much risk a trade like this is undertaking, please continue reading.
However, before we begin detailed discussions, remember that the risk of option positions is appropriately gauged against the yardstick of equivalent equity positions. Many traders have made the logical error of considering option positions constructed with the same capital against what they think is the same equity position. This is a fundamental error in logic. The appropriate yardstick by which risk is gauged is delta equivalent positions.
For many who are beginning to trade options or those that do not have enough capital, option brokers will not allow option traders to sell naked calls or puts. There is a way around this little issue; the answer lies within a credit spread which will mitigate the risk of selling a call or put naked. A credit spread is an option strategy where a trader sells a call or put, and then purchases a call or put that expires the same month/week that is further out of the money. The difference represents a credit to the traders account and the maximum gain they can achieve on the position.
I am relatively risk averse, so the structure I typically use if I want to get long involves buying a call, selling a put at the same strike, and then purchasing an out-of-the-money put a few strikes lower. The purchase of the put a few strikes lower reduces the risk that is borne by selling the put naked. Below is an example of this trade using the September SPY options. In the example, I will assume that I have a short bias and that I am using the SPY Tuesday close around $105.30/share.
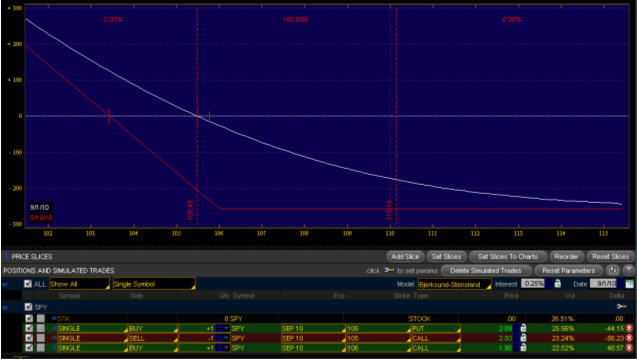
Option trading is unique due to the complex nature that operates behind the scenes mathematically which incorporates the effects of not only price, but also time and implied volatility. Options can be extremely technical, so in response to that most option traders utilize charting software that helps visualize how a specific strategy will react to price. The chart above is a visual representation of the example mentioned. The white line represents profit and loss on September 1st. The red line represents profit or loss at option expiration.
In order to illustrate the credit spread portion of the trade, note that the SPY 105 call would be sold for $250 ($2.50 per option) and the 106 SPY call was purchased for $198 ($1.98). The $52 difference represents a credit to the trader. Instead of $52 dollars hitting your trading account, option brokers utilize the $52 to reduce the cost of the total trade. In this case, the SPY 105 put was purchased for $209 ($2.09). Thus the $52 credit reduces the cost of the SPY 105 put by $52, meaning that the 105 put was essentially purchased for $157 ($1.57).
The reason the maximum risk is $257 dollars on this trade is due to the fact that if price closes at option expiration above $106/share, the trader would lose an additional $100 dollars as the spread would be upside down. $1.57 + $1.00 = $2.57 - Thus $257 is the maximum risk on this particular trade. Regardless of how high SPY climbs, at option expiration the most the option trader will lose is $257 on this specific trade, commissions not included.
The position becomes profitable around $105.15 so we are not perfectly aligned as a trader that shorted the SPY using common stock. The equity trader will capture more profit overall, but the option position will act quite similar to owning the actual stock. This is not to say that the synthetic stock position does not have risk, the risk it is exposed to is different from the equity trader. The biggest threat that a synthetic stock position like this has is Theta risk, or time decay risk. As time passes, SPY would have to move further and further to the downside to create profit for the option trader. In order to illustrate this risk, for this trade to be profitable at option expiration SPY would have to be below $103.44 just to break even.
This strategy is not new nor is it revolutionary. It is susceptible to market risk, Theta risk, and volatility risk should volatility spike or decline rapidly. This is not a trade that should be utilized for an extended period of time. This type of trade should be used similarly to a swing trade. It works well for traders who do not have the capital to trade the SPY ETF or are unable to control enough stock to make trading it worthwhile. Through the use of the inherent leverage built into options, one could achieve a return similar to an equity trader that owned 350 shares of SPY while having roughly $1,028 of maximum risk. This is not a strategy for beginners nor is it a strategy that should be employed for long periods of time, but in the right circumstances it can produce outsized profits with a fixed amount of risk.
If you would like to continue learning about the hidden potential options trading can provide please join my FREE Newsletter: www.OptionsTradingSignals.com
J.W. Jones is an independent options trader using multiple forms of analysis to guide his option trading strategies. Jones has an extensive background in portfolio analysis and analytics as well as risk analysis. J.W. strives to reach traders that are missing opportunities trading options and commits to writing content which is not only educational, but entertaining as well. Regular readers will develop the knowledge and skills to trade options competently over time. Jones focuses on writing spreads in situations where risk is clearly defined and high potential returns can be realized.
This article is intended solely for information purposes. The opinions are those of the author only. Please conduct further research and consult your financial advisor before making any investment/trading decision. No responsibility can be accepted for losses that may result as a consequence of trading on the basis of this analysis.
© 2005-2022 http://www.MarketOracle.co.uk - The Market Oracle is a FREE Daily Financial Markets Analysis & Forecasting online publication.