


Stock Market Positive Reversal Sets Up Buying Opportunities
Stock-Markets / Stock Markets 2010 Aug 30, 2010 - 09:55 AM GMTBy: David_Grandey

 MARKET STAGES POSITIVE REVERSAL FRIDAY
Friday’s action can be summed up in one picture:

Or maybe it should be “Houston We Have Lift Off”
But that should have come to no surprise as the one-minute chart of the S&P 500 told the story loud and clear — DOUBLE BOTTOM. How many times have we talked about that change in trend pattern around here? How many times have we said the early indicator that the trend is about to change from down to up is the Double Bottom pattern? This is part of the reason why we use multiple time frames and frequency charts.
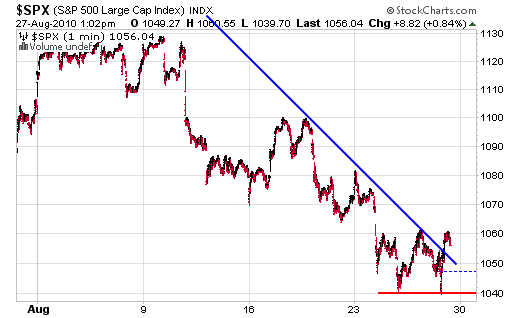
Notice how the markets instantly launched the moment it retested those lows?
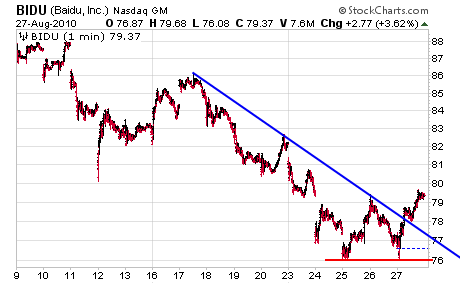
And speaking of double bottoms, take a look at market leader BIDU in the same time frequency:
And on top of that, we see the same thing when looking at the Russell 2000:
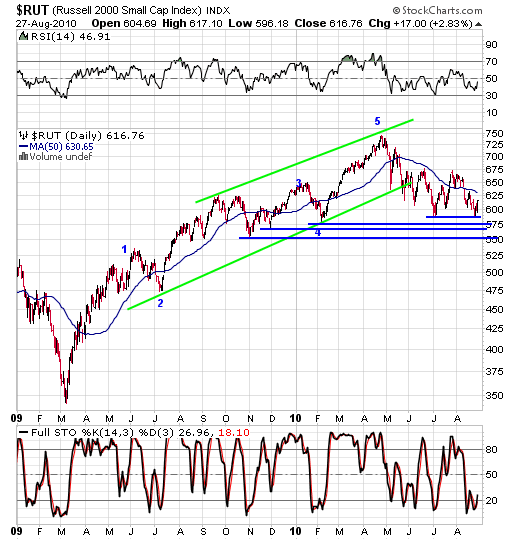
The fact that you had the double bottom, positive divergence and many of the leaders kicking into gear Friday makes us want to continue to buy stocks that have formed bullish chart patterns such as the Pullback Off Highs pattern.
=========================================================
PULLBACK OFF HIGHS — THE BEST PATTERN FOR BUYING STOCKS
So now that the market has changed its trend from down to up, it’s time to buy stocks that have formed bullish patterns.
The classic bullish pattern is what we call the Pullback Off Highs pattern.
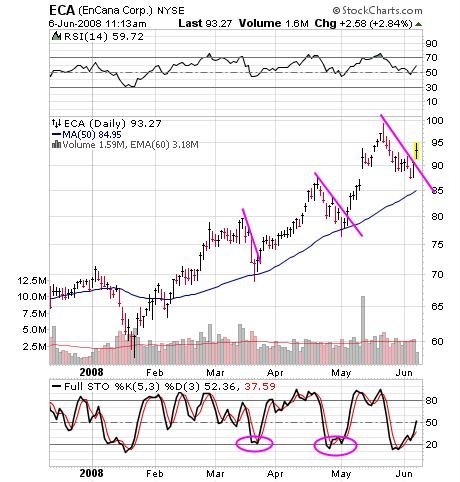
As you can clearly see this issue is locked in an uptrend. However within that uptrend you can also see a trend within the overall trend that are mini downtrends. Those mini downtrends are commonly referred to as Pullbacks Off High’s or POH’s for short. Everyday we scan for issues that are in clearly defined uptrends that are Pulling back Off Highs. Every week our paid newsletter service puts out a list of names that are showing this pattern for you to be aware of IN ADVANCE.
Last week, we featured SINA on our watch list.
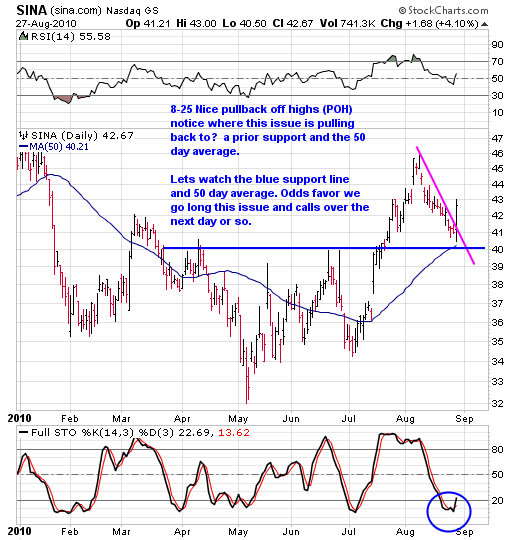
As you can see, we have an orderly pullback to chart support at the blue line and towards the 50-day moving average. The full stohcastics are very oversold. This has all of the elements for a change in trend move from down to up. And pow! Friday this issue triggered a long side trade by breaking above the pink line.
By David Grandeywww.allabouttrends.net
To learn more, sign up for our free newsletter and receive our free report -- "How To Outperform 90% Of Wall Street With Just $500 A Week."
David Grandey is the founder of All About Trends, an email newsletter service revealing stocks in ideal set-ups offering potential significant short-term gains. A successful canslim-based stock market investor for the past 10 years, he has worked for Meriwest Credit Union Silicon Valley Bank, helping to establish brand awareness and credibility through feature editorial coverage in leading national and local news media.
© 2010 Copyright David Grandey- All Rights Reserved Disclaimer: The above is a matter of opinion provided for general information purposes only and is not intended as investment advice. Information and analysis above are derived from sources and utilising methods believed to be reliable, but we cannot accept responsibility for any losses you may incur as a result of this analysis. Individuals should consult with their personal financial advisors.
© 2005-2022 http://www.MarketOracle.co.uk - The Market Oracle is a FREE Daily Financial Markets Analysis & Forecasting online publication.