Play the Treasury Bond Market Yield Curve with New ETNs
Interest-Rates / US Bonds Aug 26, 2010 - 08:11 AM GMTBy: Ron_Rowland
 Many individual investors spend their time thinking about stocks. Which stocks are going up? How high are they going? Should I buy now?
These can be important questions, but stocks aren’t the only financial market. So why do eyes glaze over when the bond news comes on? My guess is that people don’t understand how big the bond market is — or how much influence it has on everything else.
Today we’re going to talk about one aspect of bond trading and how exchange-traded products give you a new opportunity to play it. Let’s look at the …
Treasury Yield Curve
As you know, prevailing interest rates depend on many factors including the amount of time the borrower will need the money. For instance, if I loan you cash for a week, I have some assurance you’ll still be around and able to pay me when the loan comes due. If the loan is for thirty years, though, neither one of us can be certain what will happen.
In other words, longer-term loans carry more risk. Therefore, lenders want extra reward for taking on that extra risk.
This is why, under normal circumstances, long-term interest rates are higher than short-term rates. How much higher? It varies, and this is where the yield curve helps us. The yield curve is simply an illustration of current interest rates across the maturity spectrum.
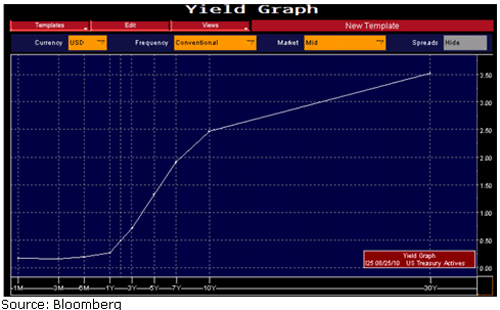
Let’s look at an example of the yield curve using U.S. Treasury debt, which are essentially loans — you the investor are loaning the government your money. Here’s what it looked like as of Wednesday, August 25 …
|
The vertical axis is the current interest rate. The horizontal axis is time to maturity. As of this date, 30-day T-bills were at 0.16 percent, two-year T-notes were at 0.48 percent, ten-year notes were yielding 2.43 percent, and the thirty-year bond yield was 3.48 percent. Put all these on a graph and you get a nice, upward-sloping curve.
Now here is the important part: How steep is the curve? Even more important, is it getting steeper or flatter? This brings us to another graph, one that my Money and Markets colleague Mike Larson shared with you last week. It’s called the “2-10 Spread.”
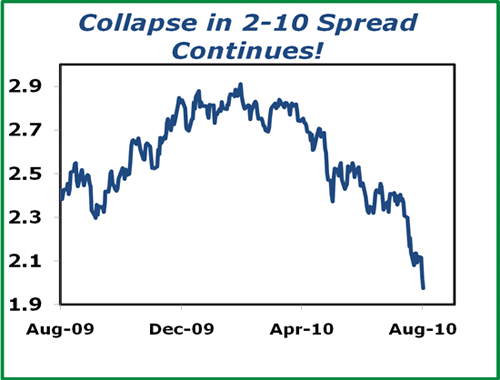
This number as shown in the chart below is simply the current yield on ten-year Treasury securities minus the current yield on two-year Treasury paper.
|
As you can see, earlier this year the 2-10 spread was up around 290 basis points (2.90 percent). Now it’s almost down to 200 bps. This is a massive move in a fairly short time.
That means the gap between the interest rate for ten-year money vs. two-year money is smaller than it was just a few months ago. Consequently, the yield curve is getting flatter.
This makes a huge difference to traders and especially to bankers since banks make their profits by borrowing short-term and lending long-term. They have a hard time when the yield curve is flatter than usual.
Yet with the Federal Reserve keeping short-term rates close to zero and private borrowers unwilling (or unable) to commit to long-term loans, the yield curve seems unlikely to steepen in the near future.
All is not lost, though …
The nice thing about financial markets is that whenever there is movement, there is also opportunity. However, until recently strategies to play the yield curve were only available to professional investors.
But now, thanks to the exchange-traded fund revolution, you have the potential to profit from changes in the yield curve, too.
In fact, Barclays just launched two new products that make it easy:
- iPath U.S. Treasury Steepener ETN (STPP)
- iPath U.S. Treasury Flattener ETN (FLAT)
STPP and FLAT try to capture changes in the 2-10 Treasury spread. When the spread goes up (i.e. the yield curve gets steeper), STPP is supposed to benefit. And when the spread gets smaller — meaning the yield curve is flattening — FLAT is designed to go up in value.
Note that neither of these products has anything to do with whether interest rates are falling or rising. What counts is the spread, or the distance, between two-year and ten-year yields. If the spread widens or narrows and you forecast the change correctly, you can make money no matter what interest rates do.
There Are Risks, Of Course …
STPP and FLAT are exchange-traded notes (ETNs), not ETFs. This means they are essentially a form of bond issued by a bank — Barclays, in this case. So ETN holders could be left holding the bag if Barclays defaults on its debts. You can read more about ETNs in this 2009 Money and Markets column.
Also be aware that no matter what you think about the yield curve, there is no point in owning both STPP and FLAT at the same time. Because their objectives are opposite, losses in one will probably cancel out any gains in the other.
As with any new ETF or ETN, liquidity is a concern so be sure to use limit orders if you decide to try them out.
Last but not least, these products are leveraged, which means both gains and losses will be magnified.
Am I recommending either STPP or FLAT right now? No. I write about them because I want you to see some innovative examples of how the investment world is changing. You have plenty of opportunities. ETFs and ETNs just make it easier to find them.
Best wishes,
Ron
P.S. If you didn’t see my appearance on the most recent Weiss Global Forum, you can now read the transcript online. Check it out!
This investment news is brought to you by Money and Markets. Money and Markets is a free daily investment newsletter from Martin D. Weiss and Weiss Research analysts offering the latest investing news and financial insights for the stock market, including tips and advice on investing in gold, energy and oil. Dr. Weiss is a leader in the fields of investing, interest rates, financial safety and economic forecasting. To view archives or subscribe, visit http://www.moneyandmarkets.com.
© 2005-2022 http://www.MarketOracle.co.uk - The Market Oracle is a FREE Daily Financial Markets Analysis & Forecasting online publication.


