Most Popular
1. It’s a New Macro, the Gold Market Knows It, But Dead Men Walking Do Not (yet)- Gary_Tanashian
2.Stock Market Presidential Election Cycle Seasonal Trend Analysis - Nadeem_Walayat
3. Bitcoin S&P Pattern - Nadeem_Walayat
4.Nvidia Blow Off Top - Flying High like the Phoenix too Close to the Sun - Nadeem_Walayat
4.U.S. financial market’s “Weimar phase” impact to your fiat and digital assets - Raymond_Matison
5. How to Profit from the Global Warming ClImate Change Mega Death Trend - Part1 - Nadeem_Walayat
7.Bitcoin Gravy Train Trend Forecast 2024 - - Nadeem_Walayat
8.The Bond Trade and Interest Rates - Nadeem_Walayat
9.It’s Easy to Scream Stocks Bubble! - Stephen_McBride
10.Fed’s Next Intertest Rate Move might not align with popular consensus - Richard_Mills
Last 7 days
Stocks Bull Market End Game Bear Start Strategy - 20th Mar 25
Gold and System Collapse: Charting the Bank Run of the Mighty US Dollar - 20th Mar 25
Tesla's Troubles — Is it Musk or is it More? - 20th Mar 25
The Stock Market Bear / Crash indicator Window - 9th Mar 25
Big US Tech Stocks Fundamentals - 9th Mar 25
No Winners When The Inflation Balloon Pops - 9th Mar 25
Stocks, Crypto and Housing Market Waiting for Trump to Shut His Mouth! - 27th Feb 25
PepeCoin (PEPE): Anticipating Crypto Reversals using Elliott Waves - 27th Feb 25
Audit the Fed, Audit Fort Knox, Audit Everything - 27th Feb 25
There Are Some Bullish Indicators in the Silver Market - 27th Feb 25
These Metrics Identify Only 10 AI Related Stocks That Are Undervalued - 27th Feb 25
Stocks, Bitcoin, Gold and Silver Markets Brief - 18th Feb 25
Harnessing Market Insights to Drive Financial Success - 18th Feb 25
Stock Market Bubble 2025 - 11th Feb 25
Fed Interest Rate Cut Probability - 11th Feb 25
Global Liquidity Prepares to Fire Bull Market Booster Rockets - 11th Feb 25
Stock Market Sentiment Speaks: A Long-Term Bear Market Is Simply Impossible Today - 11th Feb 25
A Stock Market Chart That’s Out of This World - 11th Feb 25
These Are The Banks The Fed Believes Will Fail - 11th Feb 25
S&P 500: Dangerous Fragility Near Record High - 11th Feb 25
Stocks, Bitcoin and Crypto Markets Get High on Donald Trump Pump - 10th Feb 25
Bitcoin Break Out, MSTR Rocket to the Moon! AI Tech Stocks Earnings Season - 10th Feb 25
Liquidity and Inflation - 10th Feb 25
Gold Stocks Valuation Anomaly - 10th Feb 25

Market Oracle FREE Newsletter

How to Protect your Wealth by Investing in AI Tech Stocks

A Squeeze on the NYSE 'New Highs'?

Stock-Markets / Stock Markets 2010 Aug 25, 2010 - 03:19 AM GMT

By: Marty_Chenard

Stock-Markets

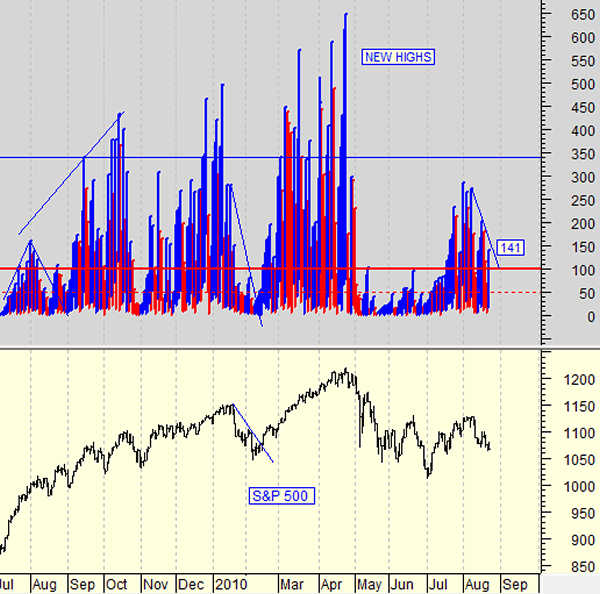
Conditions are getting close to a decision point on the New York Stock Exchange's daily New Highs.

On June 29th, the New Highs had hit a low and started an ascent that lasted until August 2nd. when they peaked and started trending down.


It has been a steady down trend, but not a big problem until now. As the New Highs move down, they are approaching a place where a "squeeze" will occur. When that happens, the New Highs will need to start a new up trend or there will be trouble.

Where is the squeeze level? As the New Highs move down, maintaining the daily 100 level is a very important level to maintain for a rally. Historically, below 100 is a high risk level, and below 50 is a real negative level.

Yesterday, the New Highs closed at 141 with a down sloping resistance line. The resistance for today is 151, so it is 1 point away from a level where a serious deterioration could start occurring. By next Tuesday, the down sloping resistance will be at 93 and that is a problem level. To not deteriorate further, you now want to see the resistance broken to the upside with the New Highs increasing. As stated, the resistance level is 151 for today.

(This chart is posted every day in Section 4, Chart 4 on our paid subscriber site.)

** Feel free to share this page with others by using the "Send this Page to a Friend" link below.

Send This Page To a Friend

By Marty Chenard
http://www.stocktiming.com/

Please Note: We do not issue Buy or Sell timing recommendations on these Free daily update pages . I hope you understand, that in fairness, our Buy/Sell recommendations and advanced market Models are only available to our paid subscribers on a password required basis. Membership information

Marty Chenard is the Author and Teacher of two Seminar Courses on "Advanced Technical Analysis Investing", Mr. Chenard has been investing for over 30 years. In 2001 when the NASDAQ dropped 24.5%, his personal investment performance for the year was a gain of 57.428%. He is an Advanced Stock Market Technical Analyst that has developed his own proprietary analytical tools.  As a result, he was out of the market two weeks before the 1987 Crash in the most recent Bear Market he faxed his Members in March 2000 telling them all to SELL.  He is an advanced technical analyst and not an investment advisor, nor a securities broker.

Marty Chenard Archive

© 2005-2022 http://www.MarketOracle.co.uk - The Market Oracle is a FREE Daily Financial Markets Analysis & Forecasting online publication.


Post Comment

Only logged in users are allowed to post comments. Register/ Log in