


Fascinating Fibonacci Price Grids and Intraday S&P 500 Price Action
Stock-Markets / Stock Markets 2010 Aug 23, 2010 - 06:20 PM GMT

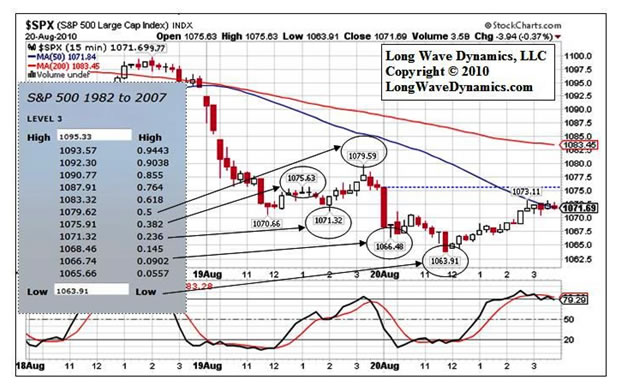
 Analyzing a 2-day 15-minute interval S&P 500 chart from last week, August 19-20, 2010, provides a valuable lesson in Fibonacci ratio related market action. The Level 3 grid included in the chart below comes from drilling down through the Fibonacci ratio price grids in the entire 1982-2007 bull market. What this chart demonstrates is that investors and traders that do not track the current Fibonacci price grids might as well be investing and trading wearing blindfolds.
In our book Jubilee on Wall Street: An Optimistic Look at the Global Financial Crash (2009), we introduced the notion that Fibonacci ratios, generated from the Fibonacci sequence, act as degrees of freedom in fields of human action, governing the ebb and flow of stock market cycles, in both price and time. Fibonacci ratios have been discovered throughout nature, from tree rings to Beethoven’s fifth symphony. In our market analysis, we view human action as a living organism, a giant beehive of sorts.
Stock charts are snap shots of human action at work in price and time in global markets, recording billions of trades as byproducts of many trillions of human decisions large and small. Long-term charts are essential tools for investors; short-term charts are the domain of traders. However, short-term charts are a subset of long-term charts at a deeper level than many investors and traders recognize. The Level 3 Fibonacci price grid in the chart below is generated from drilling down into the Fibonacci price grids beginning with a 1982 intraday low and a 2007 intraday all time high as demonstrated.
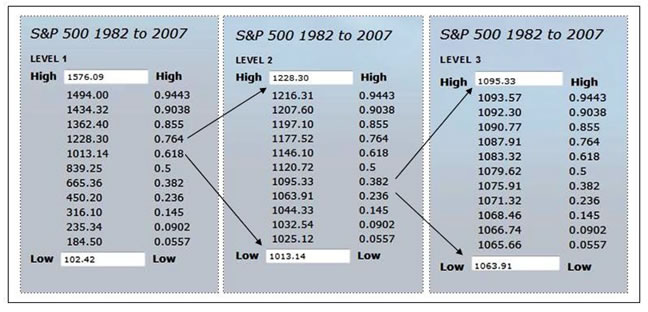
What is particularly striking about the short-term chart below is that the Fibonacci price targets can turn the market exactly, down to 1/100th of a point. The 1063.91 target price and the 1095.33 target price at the Level 2 targets that produce the Level 3 grid. Note that the 1095.33 target has repeatedly turned the market back in recent months. There are clearly Fibonacci forces at work in the universe that we are not even close to understanding, but they can be applied effectively to financial market analysis. Fibonacci forces appear to influence human action and by default produce real-time market price destiny.
To suggest that intraday millisecond price prints on a hot summer August day in 1982 and a cool fall October day in 2007 are influencing and even nailing an intraday print exactly last Friday, in August 2010, has staggering implications for financial market analysis, forget the philosophical implications. These sorts of Level 3 and Level 2 turns are going on every day. You can even drill down to Level 4 and Level 5, with stunning observations of Fibonacci ratios in market price behavior, but the top-level Fibonacci targets and larger cycles are more important for both investors and traders.
You can interpret this sort of Fibonacci chart in a number of ways. Fibonacci price grids are powerful natural phenomenon that impact price action, acting as degrees of freedom in fields of human action, or high frequency traders, hedge funds and others think they are and have programmed them into their trading platforms, or both. Our view is option three; we suspect they are in fact both. They represent real natural forces at work, and investors and traders are using them to execute their various trading and investing strategy, thus making them show up on stock charts with remarkable detail and therefore making them essential tools for all investors and traders.
Fundamental analysis and technical analysis are often viewed as two entirely different methods of financial market analysis. A technical analysis method that is remarkably precise on a daily chart, but is derived from intraday price points 25 years apart, clearly integrate the economic fundamentals over that span of time. Interest rates, production, debt, prices, even government intervention, they are all part of market action and priced into a major market index like the S&P 500.
Of course, the chart presented is just looking at price in a very small window. Fibonacci ratios and the forces they generate are also active in market cycles in time. Ideal cycle lengths have been discovered, which fluctuate by Fibonacci ratios in time. Drilling down through the time cycles in the same way you drill down through price provides a multidimensional view of market action. Starting with the long wave cycle, you drill down to the long wave seasons in time. The fact that the global economy is in a Kondratieff long wave winter season of debt collapse, overproduction and deflation is getting more difficult to dispute.
Drilling down from the long wave winter season you get to the business cycle, which appears to have peaked, and has set the global economy up for a double-dip of historic significance in the down log of the final business cycle of the long wave winter season. We perform this cycle drill-down exercise, accompanied by charts, in every issue of The Long Wave Dynamics Letter for subscribers around the world that are interested in tracking Fibonacci in price and time in global markets.
Drilling down from the business cycle to what we call the Wall cycle (aka 20-week cycle), the current Wall cycle is looking a bit wobbly, like it wants to rollover. Few investors and traders recognize that a Wall cycle is technically a miniature long wave cycle, and the extensive implications. The current Wall cycle has now produced a double top in the S&P, while other key global markets ran higher. The S&P has thus far refused to follow, trumping Dow Theory with the daily trading of the S&P 500, which includes a broad reading of the largest U.S. corporations. These companies are doing increasing amounts of business globally, so the S&P 500 also serves as a global index. The Wall divided by four produces the Quarter Wall cycles, which are the key to analyzing the market’s exact location within the Wall cycle.
In short, price and time are both running out it this long wave. The picture the cycle charts are painting is a bit ominous, i.e., the bear market rally since March of 2009 looks like it has run out of steam. When the 61.8% golden ratio support in the S&P 500 at 1013.14 goes, the market will be in serious danger.
Enjoy the rest of your summer, because the Kondratieff long wave winter is now beginning its acceleration phase into 2012.
David Knox Barker is a long wave analyst, technical market analyst, world-systems analyst and author of Jubilee on Wall Street; An Optimistic Look at the Global Financial Crash, Updated and Expanded Edition (2009). He is the founder of LongWaveDynamics.com, and the publisher and editor of The Long Wave Dynamics Letter and the LWD Weekly Update Blog. Barker has studied and researched the Kondratieff long wave “Jubilee” cycle for over 25 years. He is one of the world’s foremost experts on the economic long wave. Barker was also founder and CEO for ten years from 1997 to 2007 of a successful life sciences research and marketing services company, serving a majority of the top 20 global life science companies. Barker holds a bachelor’s degree in finance and a master’s degree in political science. He enjoys reading, running and discussing big ideas with family and friends.
© 2010 Copyright David Knox Barker - All Rights Reserved Disclaimer: The above is a matter of opinion provided for general information purposes only and is not intended as investment advice. Information and analysis above are derived from sources and utilising methods believed to be reliable, but we cannot accept responsibility for any losses you may incur as a result of this analysis. Individuals should consult with their personal financial advisors.
© 2005-2022 http://www.MarketOracle.co.uk - The Market Oracle is a FREE Daily Financial Markets Analysis & Forecasting online publication.