The Hindenburg Stock Market Omen Doomed to Crash and Burn?
Stock-Markets / Stock Markets 2010 Aug 22, 2010 - 01:01 AM GMTBy: Nadeem_Walayat

 The dreaded Hindenburg Omen (HO) has been making the rounds in the mainstream press and BlogosFear for the past few weeks, which purportedly heralds an imminent stock market crash.
Hindenburg Seller: Market Oracle Checks Out - Barrons - 21st August 2010
ES MIEKKA, A BLIND ORACLE credited as the author of the Hindenburg Omen, a predictor of stock-market crashes that has been getting a lot of buzz, sold his stock positions last week.
The Omen was triggered Aug. 12, when new 52-week highs and lows exceeded 2.5% of issues traded on the New York Stock Exchange, the 50-day moving average rose and three other factors confirmed a confused market. It happened again on Friday, he says.
Hindenburg Omen' Indicator Suggests Slump in Stocks: Technical Analysis - Bloomberg - 13th August 2010
This week’s plunge in U.S. stocks triggered a technical indicator known as the Hindenburg Omen that may signal a more severe sell off, according to analysts who follow charts to predict market moves.
Dr Doom on stock markets, the Hindenburg Omen and what next - FT - 31st July 2010
“Normally a single signal is not of great significance, but when several signals occur within a short period of time, the odds for a stock market crash increase”, says Faber.
As of Tuesday, July 23, the Hindenburg signal had fired at least eight times over the previous six weeks. The Hindenburg Omen is the alignment of several technical factors that measure the underlying condition of the stock market and warns of either impending market crashes or severe declines.
Do you notice that the HO is apparently more common than the theory suggests it should be? Which implies that it is overly complicated and highly subjective rather than technical as illustrated by Marc Faber's comments of several Hindenburg events in July.
What Exactly is the Hindenburg Omen Indicator?
The criteria for the Hindenberg stock market crash omen are -
1. The Number of NYSE 52 week New Highs and Lows are both greater than 69
2. New highs cannot be more than double the new lows
3. Rising 10 Week NYSE Index Moving average
4. A negative Mcclellan Oscillator on the same day.
That the HO should be repeated within 36 hours to confirm a signal, else it is an unconfirmed HO.
This month (August 2010) has seen three occurrences of the HO, first on the 12th (unconfirmed HO), then on the 19th and again on the Friday the 20th with 83 New highs and 95 New lows thus confirming the HO and signaling an imminent crash.
My View - If you have been following my analysis / commentary for any length of time then you will know that I consider all individual tools, indicators and theories as no more reliable on their own than a coin toss i.e. a 50/50 probability, and therefore it should be the job of the analyst to pull all the threads together towards a arriving at a probable final conclusion.
The problem I see with the Hindenberg Omen and its kind is that it is too easy to generate a back fitting indicator that perfectly calls every top or bottom in hindsight but going forward requires constant revisions to make the indicator fit onto future price action, which basically means you have a 50/50 chance (or less) of the indicator going forward producing the outcome that it purports to forecast, as each time it fails the indicator is changed to allow for the reason as to why it failed which basically means fewer and fewer occurrences which does NOT mean that it becomes more accurate rather more accurately fitting the data in hindsight.
To effectively use the HO, it must be part of broader unbiased analysis as the biggest mistake analysts make is by attaching near certainty of outcome to an indicator that then clouds their judgement at arriving at a more probable conclusion. So the HO is no better or worse then any other technical indicator and should be treated as such rather then to be elevated to a level that generates headlines of imminent stock market doom. Given the fact that the HO's are rare this to me suggests that it is pretty much worthless as it does not allow for the build up of experience of using the indicator along with all other analysis on an going basis. It is infinitely better for analysts or traders to train themselves to use simple trendlines than waste time on tracking once in a blue moon indicators such as the HO.
Also remember that stock market crashes are extremely rare and near impossible to forecast events as illustrated by the long history of failure, remember October 2009? That was supposed to have witnessed a repeat of Black Monday that NEVER happened. Whilst the May 6th Flash Crash was missed by ALL.
The facts are that the main proponents of the Hindenburg Omen have been WRONG throughout the WHOLE Bull market from its birth in March 2009 and subsequent 18 month trend, the perma-bears each month jump from indicator to indicator (In June and July the Head and Shoulders pattern was all the rage) all the while hoping all the past investment account busting wrong calls have been forgotten as they wait to eventually be right, even a broken clock is right twice a day.
Stock Market Trend
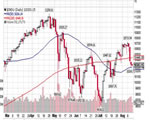
Last weekends quick stock market analysis (15 Aug 2010 - Central Bankers Stoking the Inflation Fires, Whilst Academic Economists Worry about Deflation ) concluded in expectations for the Dow to target a trend towards 10,100 for a possible low after failing to hold 10,700. This week the Dow closed down at 10,213, and put in a fresh low at 10,147. Considering the prevailing HO bearishness of the past 48 hours which could have limited negative impact on the market next week, the Dow could now trade down into the 10,000 to 10,100 zone. I am looking at the chart and its not showing anything other than remaining within a tight corrective trading range of between 10,700 and 10,000.
The risks to the scenario remains of a break below 10k to target 9,614 low a break of which would imply a larger ABC pattern that targets a downtrend into October (current scenario is that the early July marked the ABC correction low to target 10,700 then 11,250). So unless I see a breakout form the tight range, I still don't see the point of taking the time to do an in-depth analysis at this point.
Pakistan Floods Crisis Worsens
The floods crisis in Pakistan has now put 20% of the country under water with the number of people affected expanding to 20 million from 14 million. The growing risk is that from the outbreak of water bourne diseases such as cholera that could see the death toll multiple into the tens of thousands unless urgent action is taken. Looking beyond the floods, Pakistan's already war and recession weakened economy lies in tatters that risks political and social instability which could spill over into neighbouring countries.
UK Donations

USA Donations

Your analyst.
Comments and Source: http://www.marketoracle.co.uk/Article22092.html
By Nadeem Walayat
Copyright © 2005-10 Marketoracle.co.uk (Market Oracle Ltd). All rights reserved.
Featured Analysis of the Week
|
|
|


|
|
|

|
|
|


 |
|
|
|


|
|
|


|
|
|

|
|
|
|
|
|
|


Most Popular Financial Markets Analysis of the Week :
| 1. U.S. Heading for Currency Destruction Debt Default Great Depression |
By: Doug Casey
As the world sinks deeper into what he calls the Greater Depression, Casey Research Chairman Doug Casey sees default on the U.S. national debt as inevitable—albeit probably in the guise of currency destruction. He anticipates further contraction in real estate, particularly on the commercial front. As long as stocks remain overpriced, he'll shy away from equities—except perhaps in favored sectors such as gold. In fact, in this exclusive interview with The Gold Report, Doug posits that gold juniors might "go up by an order of magnitude or more, even while most other stocks are going down."
| 2. Central Bankers Stoking the Inflation Fires, Whilst Academic Economists Worry about Deflation |
By: Nadeem_Walayat
This week the Bank of England Governor Mervyn King realised that his attempts at talking inflation down have failed and that now 8 months on he is looking rather foolish by continually stating that high inflation is just temporary, where even the mainstream press that had been lapping up the mantra are now no longer taking him seriously, so now the Governor is suggesting that inflation will remain above the 2% target level for the whole of 2011 (current CPI 3.2%, RPI 5%) which translates into watch for UK CPI to go above 4% and and RPI above 6% during 2011, in line with my expectations since early May.
| 3. Time for a New, New Deal? |
By: PhilStockWorld
What are people thinking?
It is interesting to see so many of the same people calling for a "double dip" recession while at the same time railing against government spending. The US Government is spending $3.5Tn this year. Admittedly that's $1.5Tn more than they have, but it's quite a lot of money no matter how you look at it. Conservative, born-again deficit hawks (they were born-again the day Obama was elected) will tell you the solution is to cut taxes and let corporations trickle their wealth down on the bottom 99%, well over 20% of whom are unemployed or under-employed.
| 4. Stock Market to Plunge to Below Dow 9000 by November 2010 |
By: Larry_Edelson
My apologies for being so bold in the subject line. But this is one of the most important columns I’ve ever written. Why? Because today I am going to give you a major heads up on the trends I see unfolding over the next few months.
| 5. The Connection Between Debt and Money Under Fractional Reserve Banking |
By: Robert_Murphy
Is Our Money Based on Debt?
Different groups often notice different aspects of the same phenomenon — this is the point of the famous tale of the blind men encountering an elephant. When it comes to the Federal Reserve, Austrians usually focus on how its tinkering with interest rates leads to the boom–bust cycle.
| 6. Protection From a Double-Dip Economic Recession Going Global |
By: Jason Simpkins
The last time the U.S. economy suffered through a double-dip recession, this country was struggling to overcome the fallout from an Arab oil embargo, Vietnam War-era deficits, and an inflationary spiral that just wouldn't let go.
That 1981-82 double-dip downturn - the result of an economic "shock treatment" aimed at curing those ills - consisted of two recessions that were separated by a single quarter of growth.
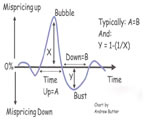
| 7. U.S. Housing 10% Below Fundamentals, BubbleOmics Says Must Drop 15% More |
By: Andrew_Butter
From Felix Salmon today: The government does need to get the housing market going, because the alternative is unthinkable: if the government just kicked away the housing market’s multi-trillion-dollar scaffolding overnight, as Santelli suggests it should, then the entire banking system would become insolvent, and we’d soon be reminiscing wistfully about how painless and shallow the 2008 financial crisis was, compared to the one of 2011
| 8. Stocks Distributing Into Weak Hands, Politicians With the Worst of Intentions |
By: Steve_Betts
Ancient Rome declined because it had a Senate, now what's going to happen to us with both a House and a Senate? - by Will Rogers, humorist
Housing foreclosures hit new highs last month as the hangover from the housing bubble continues. It is estimated that 32% of all mortgages now have negative equity, meaning the debt on the house exceeds the value of the house. So here’s a question: if you bought a house for US $400,000, you have a mortgage on it for $350,000, and it’s worth US$ 225,000, what is the proper business decision to make? I’m not talking about the moral dilemma here; I am simply looking at it as a business decision.
| Subscription |
How to Subscribe
Click here to register and get our FREE Newsletter
| About: The Market Oracle Newsletter |
The Market Oracle is a FREE Financial Markets Forecasting & Analysis Newsletter and online publication.
(c) 2005-2010 MarketOracle.co.uk (Market Oracle Ltd) - The Market Oracle asserts copyright on all articles authored by our editorial team. Any and all information provided within this newsletter is for general information purposes only and Market Oracle do not warrant the accuracy, timeliness or suitability of any information provided in this newsletter. nor is or shall be deemed to constitute, financial or any other advice or recommendation by us. and are also not meant to be investment advice or solicitation or recommendation to establish market positions. We recommend that independent professional advice is obtained before you make any investment or trading decisions. ( Market Oracle Ltd , Registered in England and Wales, Company no 6387055. Registered office: 226 Darnall Road, Sheffield S9 5AN , UK )
© 2005-2022 http://www.MarketOracle.co.uk - The Market Oracle is a FREE Daily Financial Markets Analysis & Forecasting online publication.