Beware - The Bernanke Fed Could Ignite Hyper-Inflation! Money Supply Surging, Dollar Plunging
Economics / Inflation Sep 20, 2007 - 01:51 AM GMTBy: Gary_Dorsch

 “You unlock this door with the key of imagination. Beyond it is another dimension, a dimension of sound, a dimension of sight, a dimension of mind. You're moving into a land of both shadow and substance, of things and ideas. It's a journey into a wondrous land, whose boundaries are that of imagination. That's a signpost up ahead, your next stop, the “Twilight Zone!”
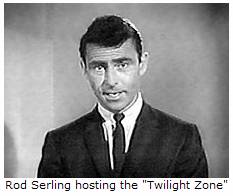
Rod Serling was a multi-talented man and a prolific writer. His television series “The Twilight Zone” ran for five seasons in the early 1960's and was extraordinary, winning three Emmy Awards. As the host and narrator, and writer of more than half of 151 episodes, he became an American household name and his voice always sounded a creepy reminder of a world beyond our control.
 Nowadays, there are numerous signposts indicating that inflation in the United States is getting out of control. The US M3 money supply is 14% higher than a year ago, its fastest growth rate in 35-years, the US Dollar Index is plunging to 15-year lows, gold is surging toward $725 /oz, a 28-year high, crude oil is cruising above $80 /barrel, wheat prices have doubled to $8.75 /bushel, an all-time high, and the Baltic Dry Freight Index has zoomed 300% higher to stratospheric levels.
It's like entering “a fifth dimension beyond that which is known to man, that lies between the pit of man's fears and the summit of his knowledge. It is an area called “the Twilight Zone,” Mr Serling explained. Could it be - the fifth dimension that lies ahead is hyper Inflation, and the re-ignition of the “Commodity Super Cycle?” Money is still pouring into commodity indexes to diversify portfolios, amid recent financial market turmoil, reaching $120 billion at the end of the second quarter, up 50% from a year earlier.
Food and energy prices are sharply higher from a year ago, and this time, the surge in these “volatile components” of inflation is not a flash in the pan. But remember, you're in the “Twilight Zone,” where perception is more important than reality, and emotions often trump logic. Putting it another way, “there is nothing so disastrous as a rational investment policy, in an irrational world,” explained JM Keynes.
Watch the dollars and cents in the Commodity Markets,
When operating in the “Twilight Zone,” traders should focus on the dollars and cents that flow thru the global commodities markets, for real-time indications about the direction of inflation, and not rely on inflation stats conjured up by government apparatchniks. Since the Fed's last rate hike to 5.25% in June 2006, the Dow Jones AIG Commodity Index has been trapped in a sideways trading range between the 160 and 180 levels, but still up six-percent from a year ago.
However, on Sept 18th, Fed chief Ben “B-52” Bernanke, finally showed his true colors, exposing himself as a radical inflationist, by slashing the fed funds rate a larger than expected half-point to 4.75%. The Bernanke Fed panicked, lost its cool, in a desperate attempt to bailout Wall Street brokers who peddled toxic sub-prime US mortgage slime around the world, and saddled banks and hedge funds around the world with losses to their balance sheets that can exceed $150 billion.
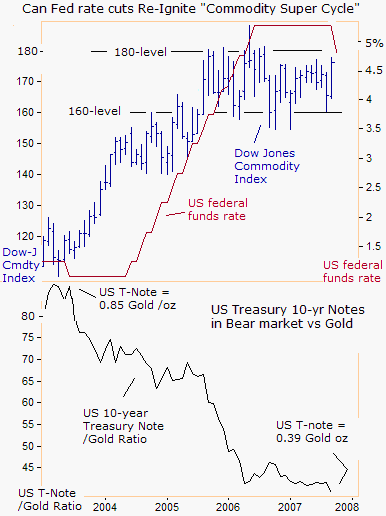
To defuse the credit crunch and still fend off inflation, Bernanke could have chosen the middle ground, by simply lowering the discount rate by a half-point. Instead, Bernanke chose the most aggressive action, by slashing the fed funds rate. Looking at the chart above, what impact would a series of Fed rate cuts have on the DJ Commodity Index? The Sept 21st edition of Global Money Trends presents a forecast for the DJ Commodity Index and a Sweet Sixteen model portfolio could inflate from Fed rate cuts and a further expansion of the US money supply.
What's the worst possible investment to own during a series of Fed rate cuts? During DJ Commodity Index's great bull run from 2003 thru mid-2006, when it climbed 56% to a 24-year high, there was simultaneous bear market for US Treasury Notes, when measured against the price of gold. This is the predicament that China finds itself in today, with an estimated $900 billion stashed away in rapidly depreciating US bonds, which have collapsed from 85-cents on the dollar to as low as 39-cents today, when measured against an ounce of glittering Gold.
Can the Fed Re-Inflate sub-prime Mortgage slime?
Toxic US sub-prime mortgage slime, has infected the biggest brokers on Wall Street, bond mutual funds, and the world's largest banks. Its latest victim is Northern Rock NRK.L, the UK's fifth largest mortgage lender, now bracing for a takeover after its shares collapsed and its customers lined the streets to withdraw their money. Last week, NRK.L confessed that has a £275 million exposure to US sub-prime mortgage slime. It also has a £325 million position in structured investment vehicles, requiring an advanced degree in calculus to figure out.
To make matters worse, about 5 million adjustable-rate US mortgages (ARM'S) are slated to reset in the next 18-months. More than two million of these ARM's are sub-prime and as many as 600,000 sub-prime borrowers could lose their homes, weighing on an already weak housing market. The US housing slump could deepen if sub-prime borrowers who took out ARM's in 2004 and 2005 to secure low teaser rates for the first two or three years of the loan are forced to refinance their loans at higher interest rates, while home values stagnate or fall.
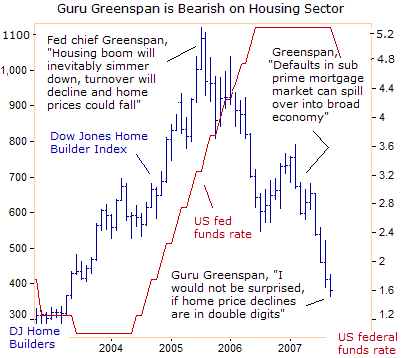
Already, there are glaring signs that the US economy might be headed for a recession. Pending sales of previously owned US homes fell by a surprising 12.2% in July, while the supply of unsold homes reached 9.6 months, a 16-year high. And the US economy unexpectedly lost jobs in August for the first time in four years. Former Fed chief “Easy” Al Greenspan, said on Sept 16th, he expects “as a minimum, large single-digit percentage declines in US house prices from peak to trough, and would not be surprised if the drop was in double digits,” he warned.
Harvard University economist Martin Feldstein, advised the former Princeton economist “B-52” Bernanke to come to the rescue of sub-prime borrowers, with the same old magic formula - printing more money, devaluing the dollar, and lowering the fed funds rate. “There is a significant risk of a recession. Downturns in housing construction have almost always been followed by a downturn in the economy, by a recession. My judgment is there is enough of a risk that the Federal Reserve should be responding by cutting interest rates,” Feldstein said on August 31st.
Since the credit market crisis unfolded in early August, the Bernanke Fed has pumped $292 billion of morphine (repos) into the banking system, the most since the September 11, 2001's terror attacks on the United States. Not all the morphine has been withdrawn however, and as a consequence, the growth rate of the M3 money supply expanded to 14% in August, and gold has jumped to $725 /oz.
Guru Greenspan sees higher Inflation, Reinforcing Gold Rally
Some Fed officials deny the linkage between the explosive growth of the M3 money supply, which the Fed is trying to hide from the public, and inflation. On Sept 11th, Fed governor Frederic Mishkin said he “did not find gold to be a particularly useful indicator of inflation.” But surprisingly, it is former Fed chief “Easy” Al Greenspan, would pegged the US fed funds rate below the inflation rate for three years, who is ringing the alarm bells about a resurgent gold market.
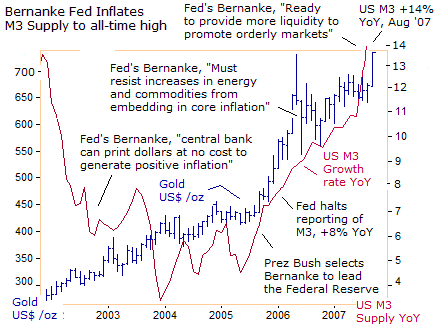
Greenspan advised “B-52” Bernanke to avoid cutting rates too aggressively because “the risk of an inflationary resurgence is greater now” than when he was nurturing the sub-prime mortgage mess. “Our problem over the long run is the re-emergence of inflation. As economic globalization winds down, the forces that have kept prices down will disappear,” he said on Sept 15th.
“Inflation in the United States could rise to a rate of between 4% and 5% a year,” Greenspan said. In an interview in the Dutch newspaper NRC Handelsblad on Sept 17th, Greenspan predicted that inflation will also rise to 5% in Europe, adding that “the 5% inflation level is more fitted for an economy that functions on a paper standard, where the currency is not linked to gold. The Fed could keep inflation lower, but to do so, it might have to raise interest rates into the double-digits.”
.gif)
Gold has been patiently waiting for the Bernanke Fed to cry uncle, and start cranking-up its money printing machines. Since the Fed halted its two-year rate hike campaign on June 25th 2006, the price of gold has climbed by 32%, and for most of this year, has been relatively stable, amid strong demand in Asia and the Middle East, and steady inflows into exchange traded funds, such as GLD and bullion.
Expectations of an easier Fed policy have crushed the US dollar, and discouraged other central banks from raising their interest rates, adding new sparkle to gold against all paper currencies. On August 6th, with gold trading at $670 /oz, Newmont Mining's Pierre Lassonde said, “There is very strong demand right now so we are setting ourselves up for an attack on the $750 /oz level in early fall this year.”
Laasonde also said that jewelry consumption in China and India suggested prices could top all-time highs of around $850 /oz next year. India, the world's largest gold buyer, boosted its demand for gold by 72% to 528 tons in the first half of 2007 compared to the same period last year. According to the World Gold Council, India's demand for gold in all of 2007 is expected to be at least 50% higher than last year. If realized, India's gold demand would exceed 1,000 tons for the first time.
Gold purchases by the United Arab Emirates rose 14.6% in Q'2 to 29.8 tons from the same period in 2006. In India and the UAE, the M3 money supply is running 20% higher from a year ago, which is attracting investors to the yellow metal. Gold demand in Saudi Arabia rose 30% to 42.5 tons in the second quarter of 2007 from 32.6 tons the year earlier, as oil prices climbed above $70 per barrel
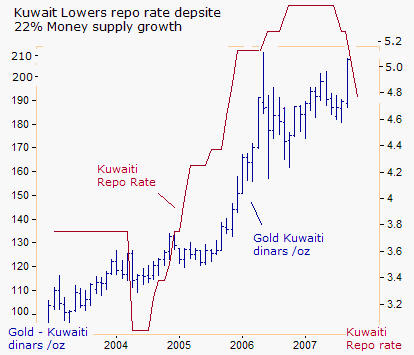
Earlier today, Kuwait's central bank cut its repo rate by 50 basis points to 4.75%, adding to its 25 basis-point cut last week. Kuwaiti rate cuts can increase credit growth, liquidity and the M3 money-supply which will add to inflationary pressures. Inflation in Kuwait is at a 12-year high of 5%, and its M3 money supply, hit 18 billion dinars at the end of July, up 22.5% from a year earlier.
Kuwait's central bank blamed rising inflation on the dinar's peg to the US dollar, which fell to a record low against the euro yesterday (Euro = $1.400), which is raising import costs. Kuwait pays for about a third of its imports in Euros. In Qatar, inflation is raging ahead at a 12.8% annualized rate, and is 6% higher in Oman. Saudi inflation surged to a seven-year high in July of 3.8% on higher food prices and rising rents, relatively restrained following the collapse of its stock market.
Can Saudi Arabia Contain Crude Oil at $80 /barrel?
It's no accident that gold demand from the Arabian Oil kingdoms is rising, with the price of crude oil is climbing above $80 per barrel, and the US$ Index is sinking below the psychological 80-level, stoking higher inflation in the Persian Gulf. Most ominously, the US dollar is sinking to 15-year lows, even before the Bernanke Fed speeds up the growth of the M3 money supply into the “Twilight Zone.”
Though oil prices have quadrupled since 2002, when adjusted for inflation the price is still below the $90-a-barrel peaks of the Iranian Revolution in 1979. Could this explain why the Dow Jones Industrials and other global stock market indexes have not shuddered at the sight of crude oil soaring to $82 per barrel? Remember when oil prices at $40 /barrel sent global stock markets into a frightful tizzy.
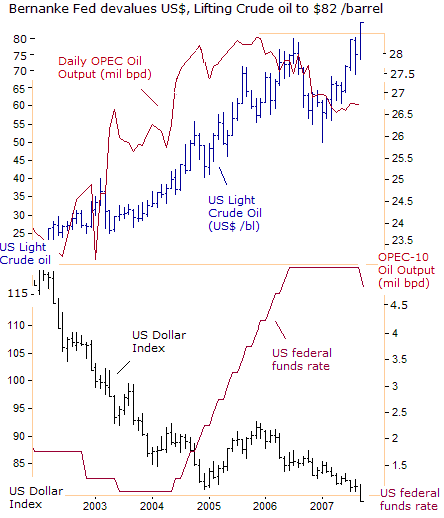
OPEC has agreed to boost its oil output by 500,000 bpd to temper any speculative rally in crude oil above $80 per barrel. But such action won't take place until November, when global demand for crude oil is expected to spike sharply higher, during the heating oil season. So far, the initial reaction in the oil market to Riyadh's gesture is “too little, too late,” with crude oil moving above $80 /barrel.
“I think higher oil prices have a lot to do with risk premium from geopolitical uncertainties,” said Saudi central banker Mohamed al-Jasser on Sept 12th. “There is no shortage of oil in the market and we have not turned back anyone who demanded oil from us,” he said. If correct, then oil companies might be hoarding oil. Why?
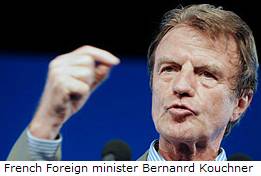 The world must “must prepare for the worst” - including the possibility of war - over the Iranian nuclear crisis, French Foreign Minister Bernard Kouchner said on Sunday, Sept 16th. “We have to prepare for the worst, and the worst, sir, is war,” Kouchner told LCI television and RTL radio. “We will not accept that such a bomb is made,” he declared.
Kouchner was later quoted by the French daily Le Figaro, “Iran does whatever it pleases in Iraq. One cannot find in the entire world a crisis greater than this one.” Kouchner's comments follow a hawkish statement by French President Nicolas Sarkozy, who candidly said in August, that a diplomatic push by the world's powers was the only alternative to “an Iranian bomb or the bombing of Iran.”
Kouchner also said Paris had advised French oil companies not to respond to tenders in Iran and repeated a call for greater pressure on Tehran over its nuclear program. “We have already asked a certain number of our large companies to not respond to tenders, and to prepare for eventual sanctions outside the United Nations, which would be European sanctions,” he said.
Israel destroys Military Site in Syria on Sept 6th
Details of Israel's attack into Syrian airspace two-weeks ago were reported on Sept 15th in the UK's Sunday Times. According to the Times, an Israeli commando team directed laser beams at a Syrian facility, for attacking Israeli F-15I's and F-16's warplanes. The Israeli commandos arrived a day earlier, taking up position near a large underground depot. Soon after, the Syrian installations were in flames.
According to unnamed Israeli sources, preparations for the attack began last spring, when Meir Dagan, the head of Mossad, presented Israeli PM Olmert with evidence that Syria was seeking to buy a nuclear device from North Korea. Dagan feared such a device could later be mounted on North-Korean-made Scud-C missiles.
 The Israeli satellite Ofek 7, launched in June, was diverted from Iran to Syria. It sent out high-quality images of a northeastern area every hour and a half, making it easy for the Israeli air force to spot the facility, the Times reported. “This was supposed to be a devastating Syrian surprise for Israel,” an Israeli source told to the Times.
“We've known for a long time that Syria has deadly chemical warheads on its Scuds, but Israel can't live with a nuclear warhead.” The Israeli warplanes were equipped with Maverick heavy missiles and 500 pound bombs. The operation “can be seen as a dry run, a raid using the same heavily modified long-range aircraft, procured specifically from the US with Iran's nuclear sites in mind,” the report said.
Equally important, the Pantsyr-S1E missiles, that Damascus purchased from Russia to repel attacking warplanes, failed to down the Israeli jets that swept across northern Syrian airspace from the Mediterranean the night before. The new Pantsyr missiles leave Syrian and Iranian airspace vulnerable to hostile intrusion. Information on Russian missile consignments to Syria or Iran is vital to any US calculation of whether to attack Iran over its nuclear program.
Fed Response to an “Oil Shock” to $100 per barrel?
If the end game with Tehran over its nuclear weapons program is finally around the corner, how would Mr Bernanke, the radical inflationist, react in a “Twilight Zone” episode in which crude oil jumps to $100 per barrel? Would it preclude the Fed from lowering the fed funds rate due to spiraling inflationary pressures?
Nobody knows for sure, but on October 21, 2004, Mr Bernanke responded to such as question, “I would argue that the Fed's response to the inflationary effects of an increase in oil prices should depend to some extent on the economy's starting point.”
“If inflation has recently been on the low side of the desirable range, and the available evidence suggests that inflation expectations are likewise low and firmly anchored, then less urgency is required in responding to the inflation threat posed by higher oil prices. In this case, monetary policy need not tighten and could conceivably ease in the wake of an oil-price shock,” Bernanke said.
So don't be surprised if “B-52” Ben argues that a weak US economy and doctored inflation statistics, justify a further easing in Fed policy, pouring more gasoline on the flames of inflation, in the event of a confrontation with Iran.
Agri-flation on the Warpath,
Rising prices of agricultural commodities including wheat, soybeans, corn, and milk have helped stoke global inflation. This trend, referred to as “Agri-flation,” shows up in prices for farm products which reached record levels in 2007. A Food Commodity Index, which tracks a dozen agricultural raw materials used by food companies including wheat, barley, milk, cocoa and edible oils, show cost inflation of 21% this year – the biggest increase since the index started almost a decade ago.
In the past 12-months, the price of milk futures have soared 70% on the Chicago Mercantile Exchange, and in most of Europe, is up 50% this year. Why the sudden upward explosion? First, a domestic shortage of nonfat dry milk and strong international demand for protein has sent powder prices skyrocketing. Second, strong demand for corn for ethanol purposes has resulted in higher feed costs for cows. Farmers have responded by raising milk prices.
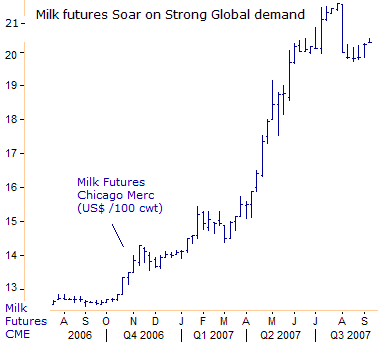
Third, China's demand for milk is soaring by 25% per year, and China is now consuming about 30% of the world's milk output, much of it from Europe and mainly from Germany. Imports of dairy-related products have surged, as per capita consumption has more than doubled since 2000, a level of increase that Chinese domestic production has not been able to match. A drought in Australia and New Zealand, the world's largest milk-exporting region, has also stoked higher prices.
Wheat futures Soar to all-time highs,
Wheat jumped to a record $8.75 per bushel on the Chicago Board of Trade, up 45% since the beginning of July on signs of strong demand for dwindling global supplies. Global consumption has exceeded production for the seventh time in eight years. As of August 23rd, US farmers sold roughly 95% percent of what the government estimates will be sold in exports all year – far ahead of the last year's pace, when the country had sold just 27% of target exports at this time. Wheat exports have also been aided by a sharply lower US dollar.
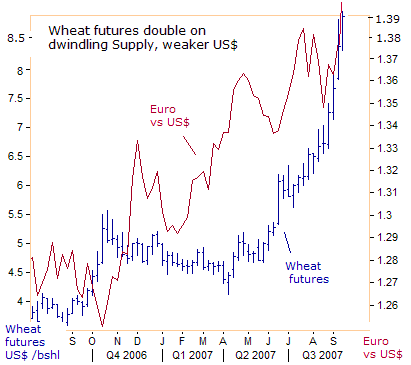
The US Department of Agriculture projects that world wheat stocks will drop to 114.8 million tons by the end of the 2007-08 marketing year, the lowest since 1982, following poor weather earlier this year in parts of Europe, the United States, and in several exporting countries including Canada, Australia and Argentina. Australia, the world's #2 wheat producer said the size of its wheat crop will fall to 15.5 million tons, from its previous forecast of 22 million tons in June.
More global demand for corn to produce ethanol, which is now blended with gasoline, helped push corn prices to a 10-year high in February. In the US, ethanol is made from corn unlike Brazil, which uses sugar cane. As of November 2006, 107 ethanol bio-refineries have been built in the US, with the capacity to produce 5.1 billion gallons of ethanol per year. It is estimated that by May 2008 another 56 refineries will be constructed producing an additional 3.8 billion gallons of new capacity.
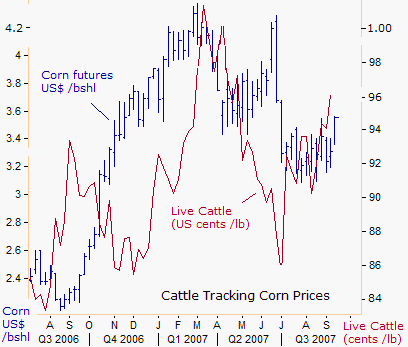
Higher wheat prices are driving up the price of corn, which is even more sought-after as an animal feed when wheat becomes too pricey a substitute. But a rise in corn prices can increase the cost of its derivatives like corn syrup, which is a staple for a variety of foods, from soft drinks to wheat bread. US corn also feeds chickens, hogs and cattle, which means a rise in prices for meat, eggs and dairy.
And as China's 1.3 billion consumers change their eating habits, and start eating beef and pork and fast-food hamburgers and chicken nuggets instead of rice, China's demand for corn and livestock can only go upwards. In China, beef consumption has gone up by 26% since 2000, and pork, which was already popular, rose by 19 percent. Even in India, where much of the population is vegetarian, chicken consumption has almost doubled since 2000.
Soybeans Soar on strong Global bio-fuel demand
Soybean prices are expected to hit their second-highest average mark ever this year, and highest since 1983, says the US Agriculture Department. Soybeans are used to make bio-diesel fuel, a renewable alternative to diesel fuel, where demand has increased more than 1,200% in the past three years, showing how US truckers are being drawn into the alternative-fuels frenzy along with the auto industry.
Most bio-diesel is made from soybeans. It can be burned pure or as a 20% blend in diesel fuel. The bio-diesel industry in the United States consumed about 202.54 million pounds of soybean oil in April, a huge jump from the 96.28 million pounds refined into bio-diesel in April 2006. Of the 148 commercial bio-diesel plants in the United States, about 63 use soybean oil as the primary feedstock, according to the National Bio-diesel Board.
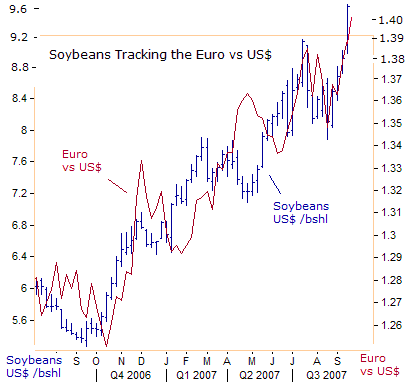
Much of the surge in soybeans to $9.60 /bushel is linked to the Bernanke's Fed's devaluation of the US dollar. The European Union wants bio-diesel to make up 6% of transportation fuels by 2010 to reduce dependence on crude oil, and a stronger Euro provides greater purchasing power to buy soybean oil, which has soared to a 23-year high. China's palm-oil imports rose 27% to 1.6 million metric tons in the first four-months of 2007 from the year- earlier period.
At the same time US farmers are switching more acreage from soybeans to corn next year. Farmers told the USDA in March, they would increase corn plantings 15% to 90.5 million acres this year from 2006, the most since 1944, and cut soybean acreage 11% to 67.1 million, the smallest since 1996. Global oilseed production for 2007-2008 is projected at 399 million tons, down 5.4 million tons from 2006-2007, the first year-to-year decline since 1995-1996, the USDA said.
Soaring Food prices send China's Inflation rate to 10-year high
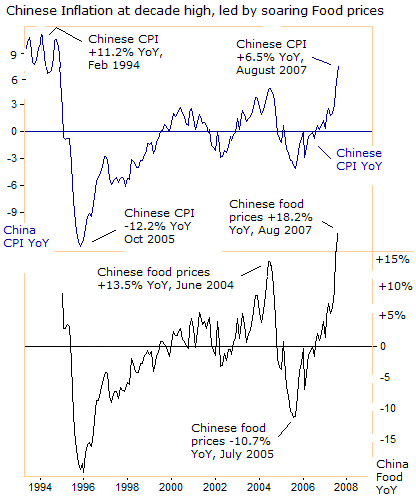
Soaring food prices have propelled China's consumer inflation to 6.5% its fastest pace in 11-years. But judging from the bubble in Shanghai red-chips, Chinese inflation is probably running in the double digits. The ruling Communist Party is aware that raging inflation has touched off social unrest in China in the past. Inflation was driven by an 18.2% leap in the cost of food, which accounts for a third of the consumer price basket.
Meat prices rose 49% in August from a year earlier, reflecting a shortage of pork, China's staple meat. The cost of eggs has risen 27% since last summer, chicken by 20%, and grain prices have climbed by 6.4 percent.
China has 20% of the world's population but only 7% of its land is arable. China has lost 6% of its arable land in the past decade to factories and houses, airports and roads in the last 20-years of breakneck industrial growth. China became a net importer of food in 2004, and just as China's growth has fueled the explosion in world prices for crude oil, iron ore, copper, steel and shipping, the impact of greater Chinese demand for food, particularly beef and pork, is just starting to be felt.
The People's Bank of China (PBoC) raised interest rates for the second time in less than a month on Sept 13th, amid soaring food prices, excessive bank lending and massive bubbles in the property and stock markets. The PBoC lifted the one-year benchmark deposit rate by 27 basis points to 3.87%, the fifth baby-step increase this year. However, the PBoC deliberately pegs the one-year bank deposit rate far below the inflation rate, for a negative rate of return, encouraging savers to shift money from bank deposits and into the Shanghai and Shenzen stock market.
Beijing is expected to continue raising interest rates and lifting the reserve rate requirement in the coming months as well as issuing more special Treasury bonds to drain liquidity from the financial system. However, Chinese 7-year T-bond yields are stuck at 4.15%, highlighting a system flush with liquidity, and further baby-step rate hikes won't put the PBoC ahead of the inflation curve anytime soon
Global Shipping Rates go Ballistic
In addition to higher prices for raw materials and grains, global shipping rates are going thru the roof, with shippers having little difficulty passing through their increased costs to importers. The Baltic Dry Index, which measures dry bulk shipping rates on 40 shipping routes, for commodities such as coal, iron ore, cement, grains and sugar climbed to an all-time high of 8,477 last week
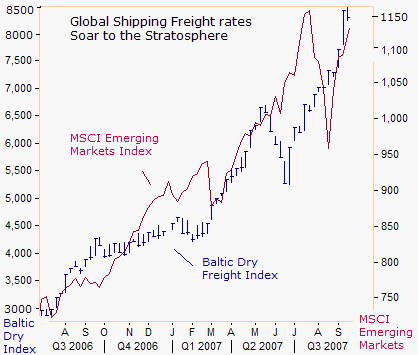
The global economy has expanded by 5% or more for the past four years, its best performance since the early 1970's, and ship owners and operators have enjoyed the strongest marine transportation market in three decades. As the middlemen of worldwide trade, shipping companies moved 90% of the $10.5 trillion in import and export volume sent across the oceans in 2006, up 60% from 2003. The Baltic dry index is trading close to 10 times its lowest level hit in November 2001.
By Gary Dorsch,
Editor, Global Money Trends newsletter
http://www.sirchartsalot.com
This article is just the Tip of the Iceberg, of what’s available in the Global Money Trends newsletter! Here's what you will receive with a subscription, Insightful analysis and predictions for the (1) top dozen stock markets around the world, Exchange Traded Funds, and US home-builder indexes (2) Commodities such as crude oil, copper, gold, silver, the DJ Commodity Index, and gold mining and oil company indexes (3) Foreign currencies such as, the Australian dollar, British pound, Euro, Japanese yen, and Canadian dollar (4) Libor interest rates, global bond markets and central bank monetary policies, (5) Central banker "Jawboning" and Intervention techniques that move markets.
GMT filters important news and information into (1) bullet-point, easy to understand analysis, (2) featuring "Inter-Market Technical Analysis" that visually displays the dynamic inter-relationships between foreign currencies, commodities, interest rates and the stock markets from a dozen key countries around the world. Also included are (3) charts of key economic statistics of foreign countries that move markets.
A subscription to Global Money Trends is offered at only $150 US dollars per year for “44 weekly issues”, including access to all back issues. Click on the following hyperlink, to order now, http://www.sirchartsalot.com/newsletters.php Call toll free from USA to order, Sunday thru Thursday, 2 am to 4 pm EST, at 866-576-7872.
Mr Dorsch worked on the trading floor of the Chicago Mercantile Exchange for nine years as the chief Financial Futures Analyst for three clearing firms, Oppenheimer Rouse Futures Inc, GH Miller and Company, and a commodity fund at the LNS Financial Group.
As a transactional broker for Charles Schwab's Global Investment Services department, Mr Dorsch handled thousands of customer trades in 45 stock exchanges around the world, including Australia, Canada, Japan, Hong Kong, the Euro zone, London, Toronto, South Africa, Mexico, and New Zealand, and Canadian oil trusts, ADR's and Exchange Traded Funds.
He wrote a weekly newsletter from 2000 thru September 2005 called, "Foreign Currency Trends" for Charles Schwab's Global Investment department, featuring inter-market technical analysis, to understand the dynamic inter-relationships between the foreign exchange, global bond and stock markets, and key industrial commodities.
Copyright © 2005-2007 SirChartsAlot, Inc. All rights reserved.
Disclaimer: SirChartsAlot.com's analysis and insights are based upon data gathered by it from various sources believed to be reliable, complete and accurate. However, no guarantee is made by SirChartsAlot.com as to the reliability, completeness and accuracy of the data so analyzed. SirChartsAlot.com is in the business of gathering information, analyzing it and disseminating the analysis for informational and educational purposes only. SirChartsAlot.com attempts to analyze trends, not make recommendations. All statements and expressions are the opinion of SirChartsAlot.com and are not meant to be investment advice or solicitation or recommendation to establish market positions. Our opinions are subject to change without notice. SirChartsAlot.com strongly advises readers to conduct thorough research relevant to decisions and verify facts from various independent sources.
© 2005-2022 http://www.MarketOracle.co.uk - The Market Oracle is a FREE Daily Financial Markets Analysis & Forecasting online publication.


