Banking Stocks Index Shows Unusual Oversold Pattern?
Stock-Markets / Banking Stocks Aug 16, 2010 - 10:29 AM GMTBy: Marty_Chenard
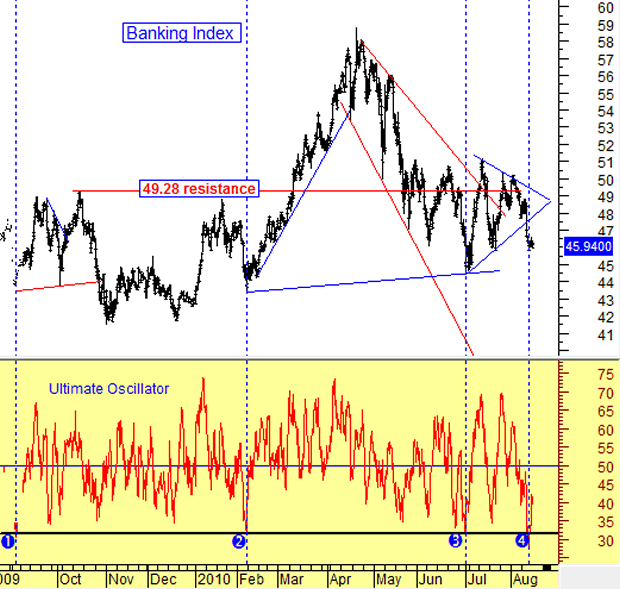
Last Monday, we posted the Banking Index chart and discussed its impending breakout of a triangular pattern.
As you may recall, the implications were for a 10%+ down move if it broke to the downside.
Well, it broke to the downside, but things are never really that simple are they?
Just after the downside breakout, the Banking Index also had a historical oversold pattern show up.
To see the oversold pattern, take notice the Ultimate Oscillator level that I added to the chart. Now, I am not a huge fan of this oscillator, but it can often help identify oversold bottoms quite nicely. For instance, look at labels 1, 2, and 3 where the indicator reached below 32 (it may be hard to see because of the vertical lines).
Each occasion was a bottom for the Banking index and it moved higher from there. I mention this because the Banking Index's Ultimate Oscillator reached a level of 27.9 last Wednesday. If the pattern of the past three occurrences holds, it would infer that the Banking Index has hit a short term bottom and will move up. However, to replicate the previous patterns fully, it needs to continue moving up to over 50 on the scale now.

** Feel free to share this page with others by using the "Send this Page to a Friend" link below.
By Marty Chenard
http://www.stocktiming.com/
Please Note: We do not issue Buy or Sell timing recommendations on these Free daily update pages . I hope you understand, that in fairness, our Buy/Sell recommendations and advanced market Models are only available to our paid subscribers on a password required basis. Membership information
Marty Chenard is the Author and Teacher of two Seminar Courses on "Advanced Technical Analysis Investing", Mr. Chenard has been investing for over 30 years. In 2001 when the NASDAQ dropped 24.5%, his personal investment performance for the year was a gain of 57.428%. He is an Advanced Stock Market Technical Analyst that has developed his own proprietary analytical tools. As a result, he was out of the market two weeks before the 1987 Crash in the most recent Bear Market he faxed his Members in March 2000 telling them all to SELL. He is an advanced technical analyst and not an investment advisor, nor a securities broker.
Marty Chenard Archive |
© 2005-2022 http://www.MarketOracle.co.uk - The Market Oracle is a FREE Daily Financial Markets Analysis & Forecasting online publication.


