The Real Reason for Bank of England's Worthless CPI Inflation Forecasts
Economics / Inflation Aug 13, 2010 - 03:46 AM GMTBy: Nadeem_Walayat
 The Bank of England released their latest quarterly inflation report this week that again sought to revise the forecast for UK inflation to converge towards 2% in 2 years time. However one major change accompanying the forecast was that the mantra of UK inflation being above the 2% target and the 3% upper limit as only temporary has now been dropped, this after repeatedly claiming month in month out for the past 7 months that Inflation would magically fall that the academic economists and mainstream press had swallowed up until quite recently.
Bank of England's August Inflation Report Highlights
The most recent August 2010 Bank of England Inflation report concluded in the following trend forecasts for UK inflation and economy.
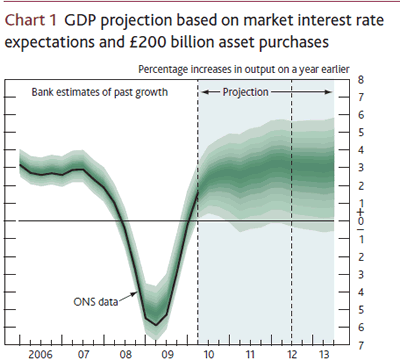 |
Chart 1 shows the Committee’s best collective judgement for four-quarter GDP growth, assuming that Bank Rate follows a path implied by market interest rates and the stock of purchased assets financed by the issuance of central bank reserves remains at £200 billion. The considerable stimulus from monetary policy, together with a further expansion in world demand and the past depreciation of sterling, should sustain the recovery. But the strength of growth is likely to be tempered by the continuing fiscal consolidation and the persistence of tight credit conditions. |
The Bank of England's UK GDP Growth Fan forecast chart shows a forecast for 2011 as being between 0% and 6%, which basically covers all eventualities, the core forecast by ignoring the fan suggests GDP for 2011 of 3%.
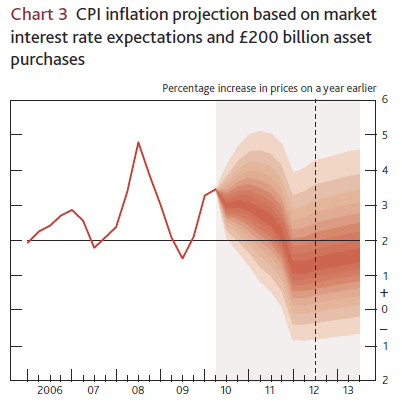 |
Chart 3 shows the Committee’s best collective judgement for the outlook for CPI inflation, based on the same assumptions as Chart 1. Inflation is likely to remain above the 2% target for longer than judged likely in May, in large part reflecting the increase in the rate of VAT to 20% in 2011. As the temporary effects adding to inflation drop out of the twelve-month comparison, downward pressure on wages and prices from the persistent margin of spare capacity is likely to bring inflation below the target for a period. |
The Bank of England's UK CPI Inflation Fan forecast chart shows a forecast for end 2011 as being between -1% and +4%, which again covers all eventualities, the core forecast by ignoring the fan suggests CPI for end 2011 of +1.2%.
Bank of England's Worthless Inflation Forecasts
The Bank of England's core inflation forecast virtually always converge towards UK Inflation hitting its 2% CPI target in 2 years time which statistically fails to happen 96% of the time. This also means that the forecast trend also fails to be achieved as is usually the case within a matter of months from the publication of each quarterly inflation report as we have seen for the whole of 2010. Off course as illustrated above the Bank of England uses a wide fan chart mechanism to ensure that all eventualities are covered therefore technically the BOE forecasts can never be wrong as the forecast fan continues to expand going forward as the most recent inflation report illustrates that in 2 years time UK inflation could be between 4% and -1%. However whilst this may fool the the government, it amounts to a worthless exercise when it comes to actually making personal and business decisions.
The focus of this analysis is in comparing the BoE Forecasts over the past 2 years of where it expected the most recently released CPI inflation for June 2010 to be, i.e. the actual 3.2% against the forecasts during the past 2 years of where it should be -
Aug 2008 Inflation Report - CPI Forecast for June 2010 1.7% - Deviation From Actual 3.2% = -1.5%
Nov 2008 Inflation Report - CPI Forecast for June 2010 0.8% - Deviation From Actual 3.2% = -2.4%
Feb 2009 Inflation Report - CPI Forecast for June 2010 0.8% - Deviation From Actual 3.2% = -2.4%
May 2009 Inflation Report - CPI Forecast for June 2010 1% - Deviation From Actual 3.2% = -2.2%
Aug 2009 Inflation Report - CPI Forecast for June 2010 1.5% - Deviation From Actual 3.2% = -1.7%
Nov 2009 Inflation Report - CPI Forecast for June 2010 1.6% - Deviation From Actual 3.2% = -1.8%
Feb 2010 Inflation Report - CPI Forecast for June 2010 1.8% - Deviation From Actual 3.2% = -1.4%
The Bank of England's CPI forecasts illustrate an inflation trend that seeks to gradually and magically convergence towards 2% by June 2010 which is in complete ignorance of the actual persistent failure to match the real inflation trend, which is illustrated by the fact that the BoE's failure to forecast UK inflation even barely 4 months before June 2010 in the Feb 2010 inflation report. The forecasts virtually always converge towards 2% being achieved despite the fact that reality is the complete opposite of the forecast trend.
The mainstream press as illustrated by the Financial Times is only now recognising something that I concluded on many years ago.
FT - FT audit casts doubt on Bank’s forecasts - 9th August 2010
The forecasts used by the Bank of England to set interest rates are biased and contain little useful information, a Financial Times audit has demonstrated.
Nadeem Walayat - Bank of England's Worthless 2% 2Year CPI Inflation Forecasts - 14th August 2008
The Bank of England's in depth 48 page quarterly inflation report published yesterday concludes with the forecast for UK CPI inflation to be at 2% in 2 years time. Since the Bank of England first adopted the 2% CPI inflation target back in 2003, the Bank has perpetually made the same forecast for 2% CPI in two years time, and nearly always missed the target by a wide margin. Clearly there is something wrong in the banks procedures which appears to deliver the motions of generating paper work such as the 48 page report, followed by pats on the back rather than an effective response to the failure to meet the Banks primary objective.
The Real Reason for Bank of England's Worthless Forecasts
The mainstream press still fails to comprehend an important factor that I have iterated several times over the past few years that the Bank of England DOES NOT actually forecast where the economy or inflation will be in the future. What the Bank of England is actually doing is to state where the BOE would like the Economy and Inflation to be in the future and then slaps the forecast label on the top, which where inflation is concerned is nearly always for the BOE to hit its 2% inflation target and for the economy to be immersed in an trend recovery.
This is evident by the fact that the Bank of England FAILS to hit its inflation target 96% of the time and thus relies on the gold fish memory of the press commentators that fail to register why the BoE fails in its forecasts.
It is important to realise this fact because it provides a measure as to the degree to which the Bank of England is in a state of panic as per the level of deviation from the forecast trend as illustrated in the persistent failure to forecast the most recent June 2010 CPI inflation. This panic manifests itself in a state of paralysis which I have witnessed several times over the past 10 years and where the current manifestation is in the fact that the UK base interest rate is being held at 0.5%. Just as the UK base interest rate was held at 5% during 2008 whilst the economy fell off the cliff as the at the time the Bank of England was paralysed by the fear of Inflation.
Furthermore, it makes sense that the Bank of England is NOT actually making forecasts but pumping out economic propaganda with the primary aim of reassuring the public that a. the BOE is in control of inflation when it is not, and b. that a strong UK economy is the default norm regardless of what is actually transpiring. The reason for the propaganda push is because if the BoE actually produced accurate forecasts then they would in effect be talking inflation higher and the economy down, thus making their job much harder in achieving both goals of low inflation with trend economic growth. For instance if the BOE told people the truth about high inflation at the start of 2010 then workers would have demanded higher wages during the past 8 months which could have sent inflation even higher and which the Bank of England would have been heavily criticised for contributing towards by its statements, as well as failure of the Bank to do its primary job which is to control inflation. So much better for the BoE to attempt to TALK inflation lower, hence the mantra of temporary high inflation.
Therefore politically it is much better for the Bank of England to be surprised by persistent high inflation then to forecast high inflation that implies that it is unable to do its job in controlling inflation which is the banks primary objective.
Bottom Line: The Bank of England Forecasts are NOT actually forecasts but propaganda aimed at soothing public concerns on the inflation and economic growth fronts by talking the economy in favour of where it wants the economy to be so as to enable the BOE to improve the probability of achieving its set economic targets and goals which would be far more difficult to achieve i.e. to target 2% inflation if it had to be more candid. Additionally admitting to the more probable implies that they are NOT able to do their jobs as it is far better for the Bank of England to be seen to be in error in its forecasting then to have seen high inflation coming but failed to have acted to prevent it.
The alternative view is that the several hundred economists and analysts the BoE employs are totally useless and we really are doomed as more powers are transferred over to the Bank of England from the FSA.
Consequences for Savers
Unfortunately whilst the BoE has been busy telling everyone that high inflation is only temporary and destined to fall to just 1% by the end of 2010, the coalition government had been making plans to pull the plug many of the inflation protection opportunities that savers could have used to protect their wealth such as scrapping the NS&I Index Linked certificates in June, which I have been extolling the value of since November 2009 as an excellent risk free inflation hedge. The certificates paid RPI +1% which on the most recent data of 5% would amount to a healthy tax free return of 6% which is set against the bankrupt bailed out banks that generally pay less than 2.3% on even their best accounts, with 20% or 40% of the interest received then taxed by the government, resulting in a net return that is half the CPI inflation rate, let alone RPI the more recognised measure of UK inflation.
The UK Inflation Mega-Trend Forecast 2010
UK Inflation of CPI at 3.2% for June 2010 is exactly in line with my trend forecast for 2010 as of December 2009 that projected June inflation data of 3.2%. My analysis since November has been warning of a spike in UK inflation as part of an anticipated inflation mega-trend (18 Nov 2009 - Deflationists Are WRONG, Prepare for the INFLATION Mega-Trend ) that culminated in the forecast of 27th December 2009 (UK CPI Inflation Forecast 2010, Imminent and Sustained Spike Above 3%) and the Inflation Mega-trend Ebook of January 2010 (FREE DOWNLOAD) as illustrated by the below graph.
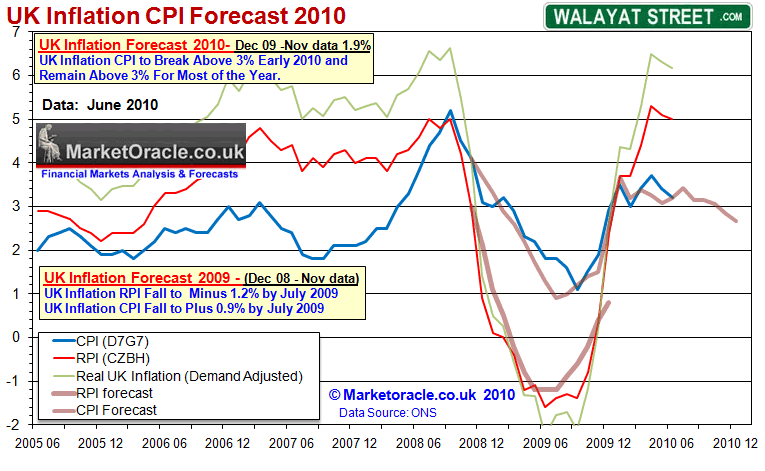
Inflation as illustrated at length in the INFLATION MEGA-TREND EBOOK, is a powerful stealth tax that the new government is using to first stabilise and then reduce the debt in terms of percentage of GDP that despite total debt increasing by 50% to £1.24trillion, the ConLib coalition government aims to stabilise the debt at about 70% of GDP and then target a trend lower to about 65% of GDP by 2016.
UK GDP Forecast 2015-2015
The forecast for UK GDP Growth from 2010-2015 was recently updated (UK Economy GDP Growth Forecast 2010 to 2015 ) which concluded in a revised growth expectation for 2011 down from 2.3% to 1.3%. Forecasts for Years 2010, 2012, 2013, and 2014 remain unchanged and are illustrated by the below graph.
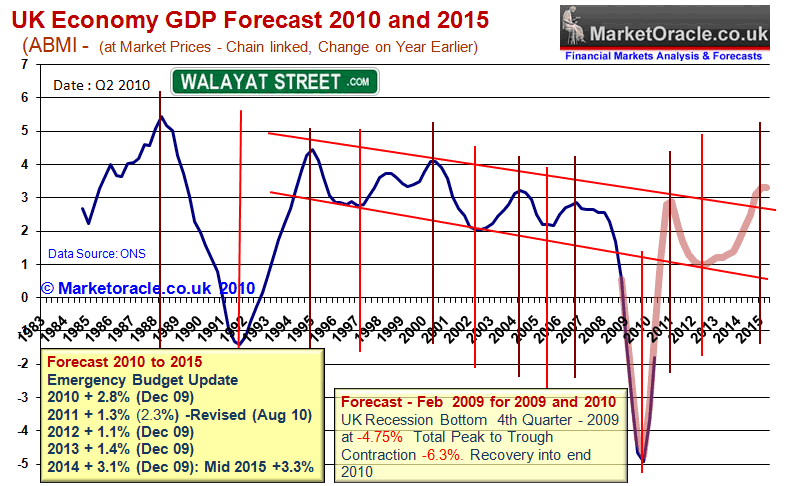
The updated analysis proved especially opportune in light of today's German GDP data which shows Germany growing at an annualised rate of 8.8% on Q2 data of 2.2%. Well beyond mainstream press and market expectations but precisely in line with my expectations of the past 3 months -
Bottom line - The large industrialised export orientated areas of the Eurozone such as Germany are going to BOOM! Therefore the PIGS sovereign debt crisis is old news. The U.S. looks set to experience sluggish growth.
This is typically set against comments such as the following in the press -
Financial Times, Martin Wolf is worried that the concerted austerity of Germany, Britain and other industrialised countries may "destroy the recovery".
To receive my in depth analysis and forecasts in your email in box then ensure you are subscribed to my ALWAYS FREE Newsletter.
Comments and Source: http://www.marketoracle.co.uk/Article21854.html
By Nadeem Walayat
Copyright © 2005-10 Marketoracle.co.uk (Market Oracle Ltd). All rights reserved.
 Nadeem Walayat has over 20 years experience of trading derivatives, portfolio management and analysing the financial markets, including one of few who both anticipated and Beat the 1987 Crash. Nadeem's forward looking analysis specialises on UK inflation, economy, interest rates and the housing market and he is the author of the NEW Inflation Mega-Trend ebook that can be downloaded for Free. Nadeem is the Editor of The Market Oracle, a FREE Daily Financial Markets Analysis & Forecasting online publication. We present in-depth analysis from over 500 experienced analysts on a range of views of the probable direction of the financial markets. Thus enabling our readers to arrive at an informed opinion on future market direction. http://www.marketoracle.co.uk
Disclaimer: The above is a matter of opinion provided for general information purposes only and is not intended as investment advice. Information and analysis above are derived from sources and utilising methods believed to be reliable, but we cannot accept responsibility for any trading losses you may incur as a result of this analysis. Individuals should consult with their personal financial advisors before engaging in any trading activities.
Nadeem Walayat Archive |
© 2005-2022 http://www.MarketOracle.co.uk - The Market Oracle is a FREE Daily Financial Markets Analysis & Forecasting online publication.


