


Panic Selling Slams the Stock Market but Will Gold Hold?
Stock-Markets / Financial Markets 2010 Aug 12, 2010 - 03:14 AM GMTBy: Chris_Vermeulen

 Did you close out any long positions today? Well if not then you are one of a few!
Today (Wednesday) the market gapped down 1.5% at the opening bell which set a very negative tone for the session. Volume was screaming as protective stops triggered and traders close out positions before prices fell much further. This gap seemed to have caught several traders off guard but those of you who follow my newsletter knew something big was brewing and to keep positions very small.
Just before the close on Tuesday I had a buy signal for the SP500 which was generated from the extreme readings on the market internals. After watching the market chop around and get squeezed into the apex of the rising wedge the past 3 weeks I knew something big was about to happen and I did not want to get everyone involved because I felt a large gap was about to happen and the odds were 50/50. Instead we passed on the technical buy signal and waited to see what would happen Wednesday.
Below are a few charts showing one of my extreme reading indicators I use which helps me to identify possible short term bottoms.
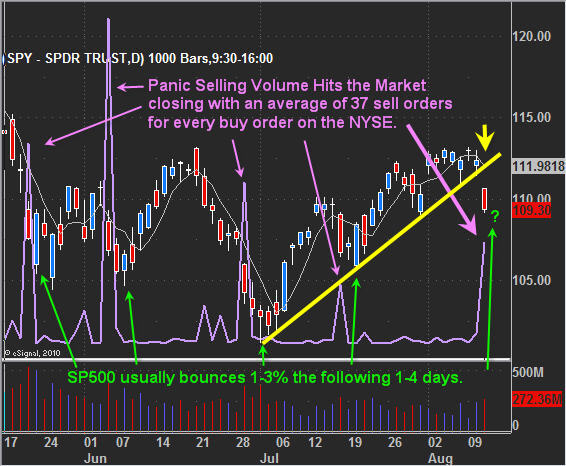
SP500 – SPY Exchange Traded Fund
This daily chart of the SPY etf clearly shows that when we see panic selling in the NYSE which I consider 15+ sell orders to each buy order to be PANIC SELLING. This is shown using the purple indicator at the bottom of the chart. Today there was an average of 37 sell orders to every buy order which tells me the majority of traders are closing out all their long positions.
In an uptrend this indicator works very well and can help time a bottom within 1-4 days. As you can see on the chart below we just had a huge sell off and everyone seemed to be exiting their positions. This panic selling tends to carry over for a couple sessions until the majority of traders around the globe are finished selling.
The problem with this indicator is that in a down trend we tend to get these panic selling spikes regularly which means this time it may not work out because of the trendline break today which I think has officially changed the trend from up to down. Because of this possible down trend starting I feel its best to wait and see if it’s a dead cat bounce or if there are real buyers behind it, then we will take action to go long or short the market.
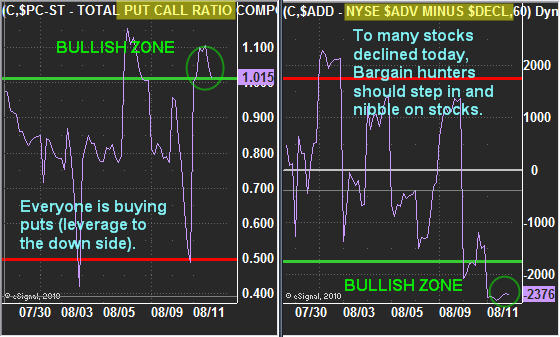
Market Internals - Put/Call Ratio & NYSE Advance/Decline Line – 60 Min Charts
Here are two charts which are currently at extreme levels. This typically means we a bounce should occur the following day or a gap higher. If you did not know there was a strong trendline breakdown today you most likely would have taking a small long position into the close.
The Put/Call ratio when above 1.00 means more people are buying put options, meaning they are leveraging themselves to make money if the market drops. As a contrarian indicator, if everyone is buying leverage to the down side then they should have sold their long positions already. That would mean most of the selling has already taken place in the market thus it should have some upward bias in the near term.
On the other side you can see the NYSE A/D line which shows how many stocks on the NYSE are advancing and how many have moved lower. When this indicator is below -1750 then we know the market is oversold on a short term basis and there should be some upward bias in the near future.
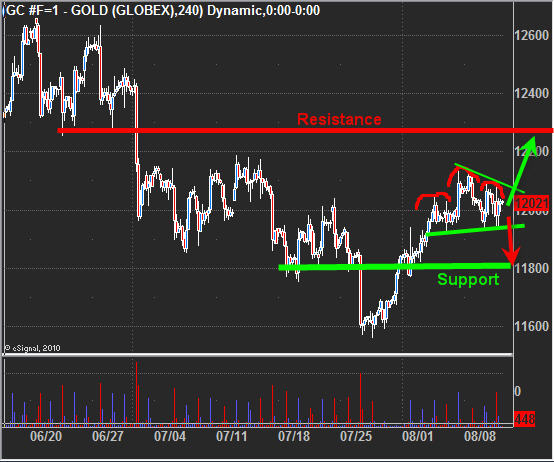
Now Lets Take A Look At Gold
Gold was left on the side of the road today as traders and investors focused on the equities market. I was actually a little surprised that it didn’t make a big move today because the US Dollar rocketed higher for the entire session. Anyone who has been watching gold closely already knows that gold is doing its own thing now… Some days it moves with the dollar, other days it does not… its become much more random than it used to be.
Anyways it looks to be forming two patterns… first one is a bull flag. If a breakout to the upside occurs thatwould send gold to the $1230-40 level.
The second pattern is a mini head and shoulders pattern which would send gold down to the $1180 area if the neck line is violated. It is a very tough call for gold.
Mid-Week Technical Traders Update:
In short, it’s going to take a day or two before we get a feel for the SP500 as we wait to see if it bounces with volume behind it. I personally would like a bounce so we can short it. It is unfortunate how the market broke down today. We were so close to getting a really good setup in either direction but the FOMC meeting shook things up and caused the large gap which in turn made a large group of traders miss that beautiful drop… It’s frustrating when you wait for something only to have a piece of news mess things up. That’s just part of trading though.
As for gold, I feel it’s a 50/50 trade and could go either way so I am not going to take a position right now. I’m just going to wait for the market to tip its hand a little more before I jump.
I hope you found this information useful. If you would like to receive these trading reports, updates and ETF alerts be sure to visit my service at: www.TheGoldAndOilGuy.com
By Chris Vermeulen
Chris@TheGoldAndOilGuy.com
Please visit my website for more information. http://www.TheGoldAndOilGuy.com
Chris Vermeulen is Founder of the popular trading site TheGoldAndOilGuy.com. There he shares his highly successful, low-risk trading method. For 6 years Chris has been a leader in teaching others to skillfully trade in gold, oil, and silver in both bull and bear markets. Subscribers to his service depend on Chris' uniquely consistent investment opportunities that carry exceptionally low risk and high return.
This article is intended solely for information purposes. The opinions are those of the author only. Please conduct further research and consult your financial advisor before making any investment/trading decision. No responsibility can be accepted for losses that may result as a consequence of trading on the basis of this analysis.
Chris Vermeulen Archive |
© 2005-2022 http://www.MarketOracle.co.uk - The Market Oracle is a FREE Daily Financial Markets Analysis & Forecasting online publication.