


Runaway Out of Control U.S. Federal Government Spending?
Economics / Government Spending Aug 12, 2010 - 02:05 AM GMTBy: Paul_L_Kasriel

 The U.S. Treasury released its budget status for July. As Chart 1 shows, the cumulative deficit in the 12 months ended July was $1.318 trillion - the lowest since June 2009's $1.255 trillion. So far, the largest 12-month cumulative deficit reading has been $1.477 trillion in the 12 months ended February 2010.
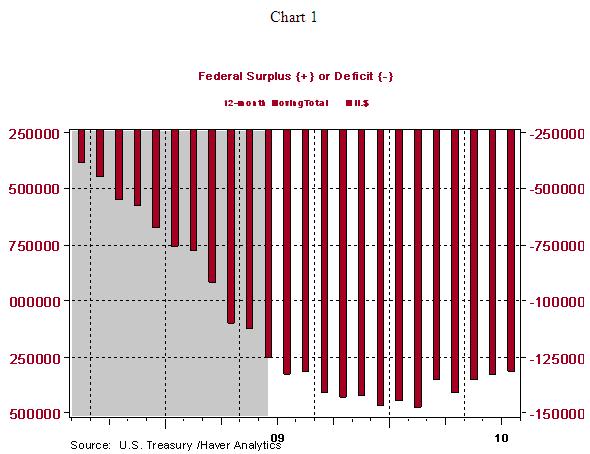
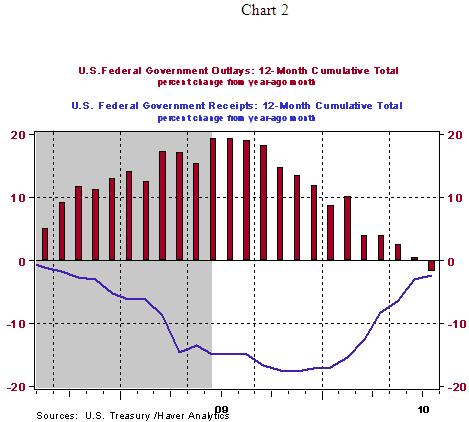
The deficit is narrowing because total federal spending has begun to decline and because total federal receipts are declining at a slower pace. As shown in Chart 2, in the 12 months ended July 2010, total federal cumulative spending contracted by 1.94% vs. the cumulative spending in the 12 months ended July 2009. The fastest growth in 12-month cumulative federal spending was 19.17%, which occurred in July 2009. Also shown in Chart 2 is the slowing in the rate of decline of federal receipts. In the 12 months ended July 2010, cumulative federal receipts contracted by 2.42% vs. the 12 months ended 2009. This is the slowest rate of contraction in 12-month cumulative federal receipts since September 2008 at minus 1.71%. The most severe rate of contraction in 12-month cumulative receipts occurred in November 2009 at minus 17.59%.
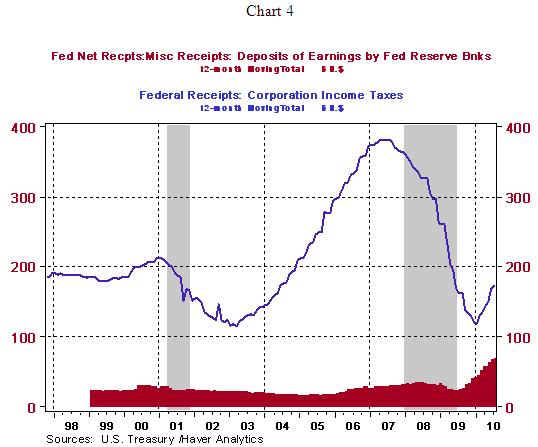
On the receipts side of the Treasury's ledger, two factors that are playing important roles in slowing down the rate of decline in federal receipts are corporate income taxes and Federal Reserve profits (see Chart 4). Now that corporations are once again earning profits after the largest contraction in corporate profits in the post-WWII era, corporate tax receipts have begun to grow again. And with the explosion of the Fed's balance sheet from $877 billion at the end of 2007 to over $2 trillion today, the Fed is enjoying record profits, most of which it turns over to the Treasury. Hooray for seigniorage!
Q2 GDP Implications of June Trade Data Not as Negative as Headline Suggests
In nominal terms, the U.S. trade deficit for goods and services widened by about $7.9 billion in June to a level of $49.9 billion - the largest monthly deficit since October 2008. In price-adjusted terms, the U.S. trade deficit for goods only widened by $8.1 billion in June to a level of $54.1 billion - the largest monthly deficit in real terms since February 2008. The widening in the June trade deficit was driven by a 1.60% decline in U.S. real exports and a whopping 4.75% increase in U.S. real imports (see Chart 5).
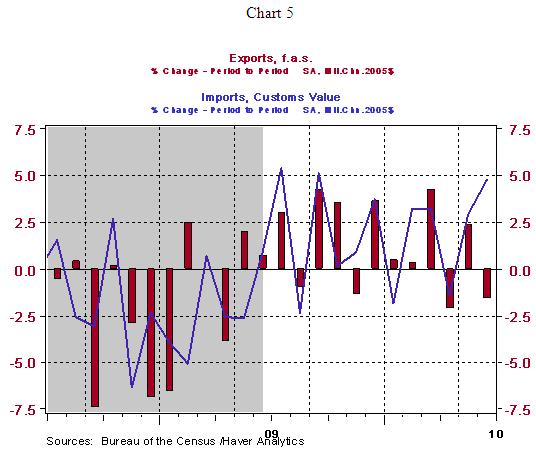
The decline in exports is an unambiguous subtraction from GDP. But the rise in imports has to show up in some expenditure category - personal consumption, business spending on equipment and software and/or business inventories. In other words, imports are a wash when it comes to adding up GDP. Imports are a subtraction from GDP but the expenditures categories where those imports end up are an addition to GDP.
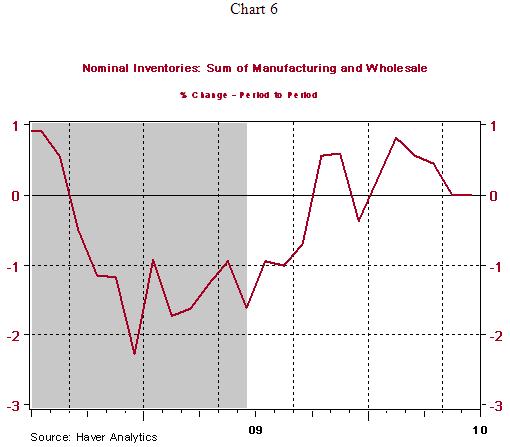
The Commerce Department already has reported manufacturing and wholesale inventories for June. As shown in Chart 6 (if you use a magnifying glass), these combined nominal inventories declined marginally in both May and June. So, pending revisions, the surge in June imports did not end up in these categories of inventories. On Friday, retail inventories for June will be reported. Given that 46% of the increase in real goods imports was consumer goods, excluding autos, there is a good chance that there was either a substantial increase in June retail inventories or there will be a significant upward revision to June retail sales. If the large increase in June consumer goods imports ends up in retail inventories, this could be a negative for GDP going forward. With consumer spending beginning to flag again, a build-up in retail inventories would portend a slowdown in new orders from retailers. To the degree that the U.S. produces retail goods - admittedly, not a very large degree - U.S. production would suffer in the coming months.
by Paul Kasriel
Paul Kasriel is the recipient of the 2006 Lawrence R. Klein Award for Blue Chip Forecasting Accuracy
by Paul Kasriel
The Northern Trust Company
Economic Research Department - Daily Global Commentary
Copyright © 2010 Paul Kasriel
Paul joined the economic research unit of The Northern Trust Company in 1986 as Vice President and Economist, being named Senior Vice President and Director of Economic Research in 2000. His economic and interest rate forecasts are used both internally and by clients. The accuracy of the Economic Research Department's forecasts has consistently been highly-ranked in the Blue Chip survey of about 50 forecasters over the years. To that point, Paul received the prestigious 2006 Lawrence R. Klein Award for having the most accurate economic forecast among the Blue Chip survey participants for the years 2002 through 2005.
The opinions expressed herein are those of the author and do not necessarily represent the views of The Northern Trust Company. The Northern Trust Company does not warrant the accuracy or completeness of information contained herein, such information is subject to change and is not intended to influence your investment decisions.
Paul L. Kasriel Archive |
© 2005-2022 http://www.MarketOracle.co.uk - The Market Oracle is a FREE Daily Financial Markets Analysis & Forecasting online publication.