


Stock Market Trends for Bulls and Bears
Stock-Markets / Stock Markets 2010 Aug 10, 2010 - 03:10 AM GMTBy: JD_Rosendahl

 At the end of July, I wrote: Stock Market Trending for Bulls and Bears Holding Hands at Lover’s Leap. The main idea was the following:
The Bearish View: If this is a head and Shoulders Top, I want to discuss the concept of Bulls and Bears Standing Hand-in-Hand at Lover’s Leap. If this is a top, it’s likely the bearish Elliott Wave count so many have highlighted is the end of Wave 2 higher and thus Wave 3 lower is about to begin. This is usually the most impulsive wave and will move swift and fast to the downside. It has everything to do with the bulls and bears in unity.
1) If the market trades lower from here, the bulls will get very nervous and begin to exit long side trades, or buy protection. That will drive stocks lower. And since the mutual fund complex has used up cash to buy stocks the past 15 months, it’s very easy for them to be big net sellers
2) Now let’s consider the bears, please see: Stock Charts: Dow Puts in Doji Near Resistance I noted in that the following:
Investors are exiting bearish bets on global equities, pushing bullish wagers on stocks to a two- year high versus short sales, according to Data Explorers.
The firm’s long-short ratio has risen to 9.5, having surged from 5.75 in September 2008 when Lehman Brothers Holdings Inc.’s collapse intensified the financial crisis, the London- and New York-based securities-research company said. The reading is the highest of the data that goes as far back as July 2008.
The collective market short position is at a two low high. There are few bears to squeeze out of the market currently.
If the market begins to decline the bears will come out of the woods of hibernation and begin to short this market.
It’s possible, that Bulls and Bears will both become sellers holding hands while jumping off Lover’s Leap that is the potential head and shoulders pattern.
Fibonacci Counts: The market has traded very nicely compared to Fibonacci numbers from peaks and troughs. The next couple days are a perfect time based on the Fibonacci count of 144 days to complete the right shoulder from the left shoulder. The RSI provides room for this to occur.
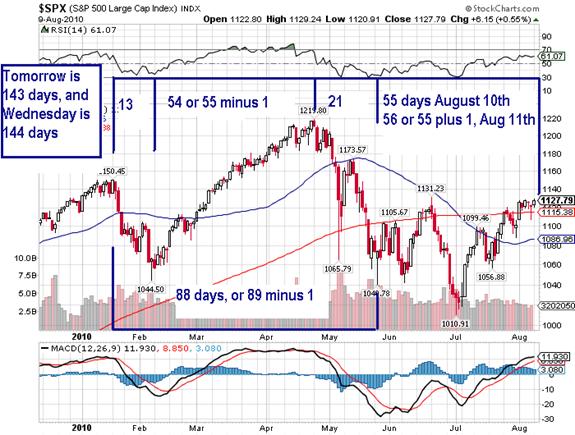
Tomorrow/Wednesday should be interesting time to say the least as the market has bought up right into a narrowing wedge.
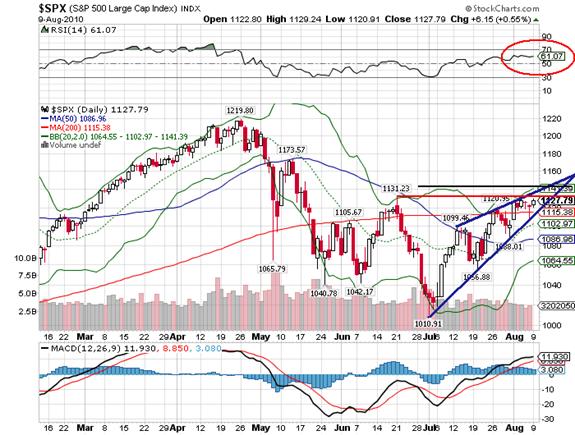
SPX-daily: The market has been tracing out a potential head and shoulders topping pattern for weeks. I had two different time frames for that right shoulder, which included July 31st and August 6/9th. August 10-11th is Fibonacci 143/144 days between left and right shoulders. The chart below reflects the market has maintained price inside the wedge and below the prior high in red and the 62% retracement level in black. It’s also below the upper Bollinger Band, which coincides with the retracement level of 62%. I’d really like to see the right shoulder finish a tad below the upper band, as that fits well within the book, “Bollinger on Bollinger Bands” on the correlation of a right shoulder and Bollinger Bands.
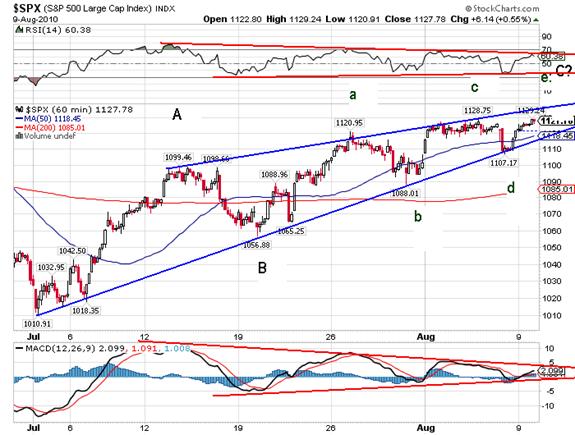
$SPX-60 minute chart: The chart reflects a wedge or ending diagonal moving higher. I’ve labeled it a 3-3-5 or ABC pattern up. The two interesting parts of this current view is first the wave ratio of c/a of C, which is 62%. Applying the same ratio to wave e/c of C we get a target of 1,132, which is the upper wedge line. Also of interesting note, is the market has wedged itself right up against Ben Bernanke speaking tomorrow.
$SPX-15 minute chart: We’re almost there on a time line. Another 5 points gets us there, so we are very close.
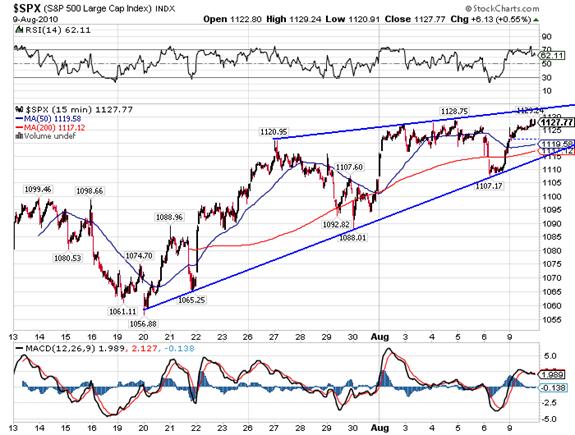
Note: If we get above 1,147 than wave e of C is bigger than wave c of C and negates the pattern’s structure of the ending diagonal. Not my primary view, but we need to know our risk.
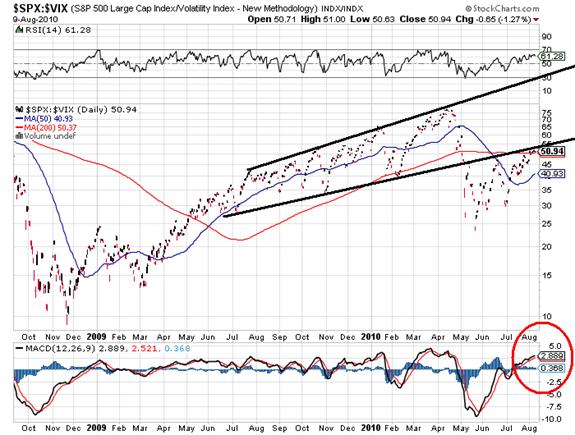
The Risk Chart: One of my favorite charts in the world is “The Risk Chart”, which is the $SPX/$VIX. It prices the market in terms of risk not dollars, which is something we should all be aware of in trading or investing. In the past few years, it has given off both reliable buy and sell signals.
Currently on the daily chart below, we see this ratio has retraced back to significant resistance. Typically, I would not expect resistance to be broken on the first attempt. Therefore, I’m expecting at least a pullback or reversal. The MACD is at a stage to provide a reversal by rolling over with the ratio. The structure of the ratio looks like an (abc) pattern up from its bottom. And, that looks like its (abc) of B up of a greater ABC wave structure down from the top.
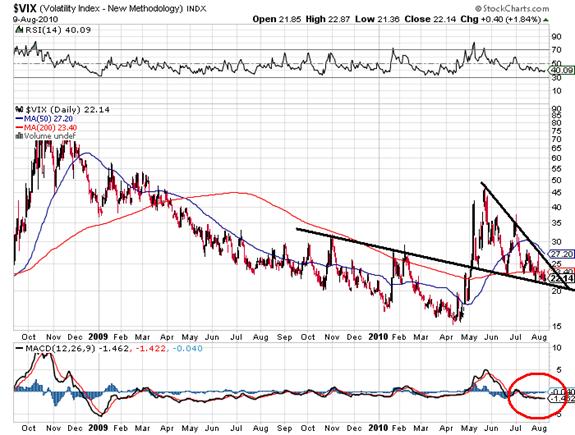
$VIX: The index itself has been coiling in a wedge on top of major support, indicating a big move in the index is coming, and we can expect the opposite move in stock markets.
Institutional Selling: Another signal of a potential top is institutional selling.
My Watch List: I have several potential bearish trading charts for review at www.roseysoutlook.blogspot.com. They include individual stocks plus ETFs like JNK, FAZ, SDS, and SRS. Feel free to take a look at the charts I’m looking at should the right shoulder confirm.
Hope all is well.
By J.D. Rosendahl
www.roseysoutlook.blogspot.com
J.D. Rosendahl was a former stock broker/investment consultant (currently not licensed) before becoming a Commercial Banker for the past 14 years. He manages his family's wealth, helping them avoid the high tech bubble and the real estate bubble melt downs and preserving wealth.
© 2010 Copyright J.D. Rosendahl - All Rights Reserved
Disclaimer: The above is a matter of opinion provided for general information purposes only and is not intended as investment advice. Information and analysis above are derived from sources and utilising methods believed to be reliable, but we cannot accept responsibility for any losses you may incur as a result of this analysis. Individuals should consult with their personal financial advisors.
© 2005-2022 http://www.MarketOracle.co.uk - The Market Oracle is a FREE Daily Financial Markets Analysis & Forecasting online publication.