


Stock Market Investor Sentiment Indicators At SubNormal Levels
Stock-Markets / Stock Market Sentiment Aug 06, 2010 - 01:39 PM GMTBy: Richard_Shaw

 David Rosenberg, in his daily letter, presented some interesting sentiment statistics in perspective of historical values during good and bad times. The implication is that there is a major disconnect between bullish comments about the economy by some experts and the view of the people where the rubber meets the road. He combines that information to suggest that the S&P 500 is substantially overvalued.
The Statistics (quoted from his letter):
"The University of Michigan consumer sentiment index — currently at 67.8 in July — is the lowest since November 2009. What is the average during recessions? 73.8. What does it average in economic expansions? Try 90.9. So you tell us where we are in the cycle.
Ditto for the Conference Board consumer confidence survey. It was 50.4 in July — a five month low. The average during recessions is 70.4, and 102 in expansions. In other words, it is still 20 points below the recession averages.
The National Federation of Independent Business small business optimism sentiment was 89.0 in June — a three month low. The average during recessions is 91.9. The average during expansions is 100.2. Again, you be the judge."
His View On S&P 500 Valuation:
With the index consensus 2011 EPS at about $76, and the subnormal sentiment levels, Rosenberg suggests an appropriate multiple for that expected level of earnings would be 10X to 12X. He didn't do the multiplication, but it comes out as $760 to $912. Those levels are about 20% to 33% lower than today's S&P 500 price level.
Key proxies for the index are SPY, IVV and VFINX
Some Important Counter Arguments:
The way people feel, and the earnings of companies, are not necessarily directly proportional, particularly if the companies earn money globally and the sentiment is measuring in a single country.
Earnings have certainly improved greatly over 2009 and 2008, and operating earnings (before write-downs and other special charges) are predicted to be high. P/E multiples reward growth and absolute earnings levels.
Europe seems to be working out its sovereign debt issues.
Emerging market economies are growth at a pretty good clip.
Some Counter-Counter Arguments
Sentiment and spending behaviors in the US are important ultimate drivers of earnings for companies with large sales components arising from the US.
Analysts may have a tendency to extrapolate earnings trends sometimes too far.
China seems to be slowing (still fast, but slower).
Accommodative Federal Reserve policies persist, and US legislative and executive decisions are hard to predict, except that they will substantially change.
Interest rates continue to decline (bonds and stocks probably can't both be right).
The Dynamic Indecision Range:
These sorts of opposing views and supporting information have put the S&P 500 into a tense range of indecision that is approximately the range defined by the precipitous crash in 2008.
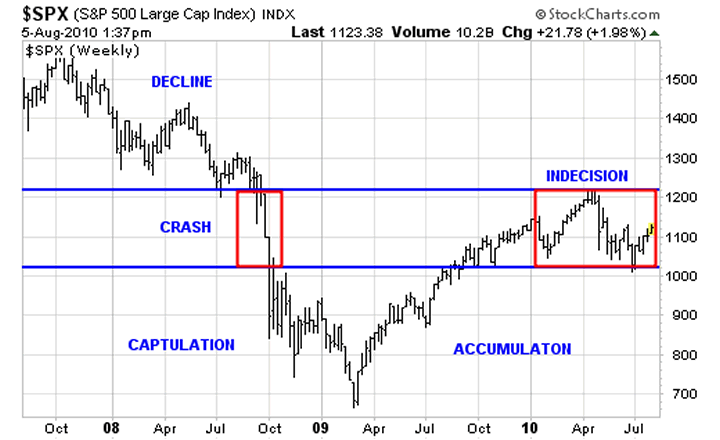
There will be resolution eventually, but that resolution could be a movement above or below the indecision range. We are still very much dependent of government tax and fiscal policies, and central bank interest rate and quantitative easing decisions.
Our Current Approach:
We don't claim to know which way the trend will develop. We tend to be a bit bearish short-term, but have generalized faith in the capacity of major major companies to prosper, which makes us bullish long-term
Our approach was to exit all equities in the first half of 2008 (losing some money, but not participating in the crash); keeping equity allocation in reserves until June-July of 2009; exiting European equities in 4Q 2009; exiting emerging market equities in 1Q 2010; and exiting US equities in May of 2010. At this point we are partially reinvested in equities (20% to 25% of equity allocation committed, with 75% to 80% of equity allocation still held in reserve). The portion of equity allocation that we have re-risked is in higher yielding, up trending equities in the US; and in up trending emerging market country funds.
We are looking for opportunities to commit more, but want to see price trend "proof" first. In a market as fragile as this one, with so many government factors, we are concerned about "value traps" that could result by trying to pick undervalued stocks. We are trend followers generally, anyway, but feel we need to be all the more strict in seeking demonstrated trends before risking capital under current conditions.
ETFs Cited: SPY, IVV
Holdings Disclosure: As of August 5, 2010 we do not own any securities mentioned in this article in any managed accounts.
By Richard Shaw
http://www.qvmgroup.com
Richard Shaw leads the QVM team as President of QVM Group. Richard has extensive investment industry experience including serving on the board of directors of two large investment management companies, including Aberdeen Asset Management (listed London Stock Exchange) and as a charter investor and director of Lending Tree ( download short professional profile ). He provides portfolio design and management services to individual and corporate clients. He also edits the QVM investment blog. His writings are generally republished by SeekingAlpha and Reuters and are linked to sites such as Kiplinger and Yahoo Finance and other sites. He is a 1970 graduate of Dartmouth College.
Copyright 2006-2010 by QVM Group LLC All rights reserved.
Disclaimer: The above is a matter of opinion and is not intended as investment advice. Information and analysis above are derived from sources and utilizing methods believed reliable, but we cannot accept responsibility for any trading losses you may incur as a result of this analysis. Do your own due diligence.
Richard Shaw Archive |
© 2005-2022 http://www.MarketOracle.co.uk - The Market Oracle is a FREE Daily Financial Markets Analysis & Forecasting online publication.