


Wall Street’s Mood Shift Signaling a Profit-Making Stock Market Price Push Ahead
Stock-Markets / Stock Markets 2010 Aug 02, 2010 - 05:44 AM GMTBy: Money_Morning

 Jon D. Markman writes:
A mood of mild optimism has begun to spread down Wall Street not long after there was nothing but long faces. Fancy that.
Jon D. Markman writes:
A mood of mild optimism has begun to spread down Wall Street not long after there was nothing but long faces. Fancy that.
More good news out of Europe, better-than-expected new home sales, and the latest of a solid second-quarter earnings season has helped resuscitate the animal spirits that were missing in action since the spring.
Stocks rose past some key milestones in their historic July over the past week, pushing the Dow Jones Industrial Average just barely into positive territory for the year. It was a very professional, low volatility rally this week, a welcome change from the intra-day dramatics that had put everyone on edge lately.
What has really changed from the point of view of government policy or corporate results? Nothing and everything.
The nothing is interest rates, inflation, fiscal spending and earnings are the same now as they were three months ago. The everything is that negative sentiment was washed out by selling in the worst May-June span since 1940 amid fears ranging from an ecological disaster in the Gulf of Mexico to a debt disaster in Europe. When facts and feelings meet in a dark alley on Wall Street, mood tends to win -- at least for a spell.
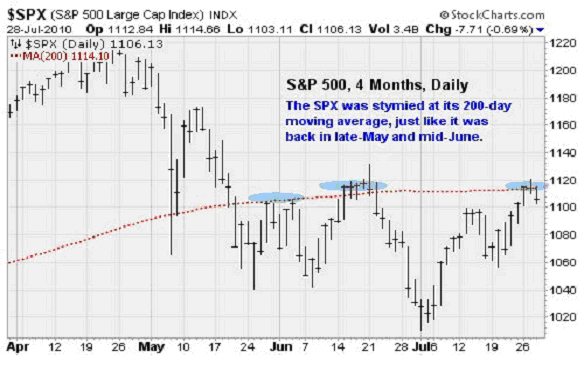
Technically, two key hurdles were cleared this week, though others remain. The Standard & Poor's 500 Index joined the other major indices, including emerging markets, in lifting just slightly above its 200-day moving average. And the CBOE Volatility Index (VIX) slipped beneath its 200-day moving average for the first time since April. This often greases the skids toward higher prices.
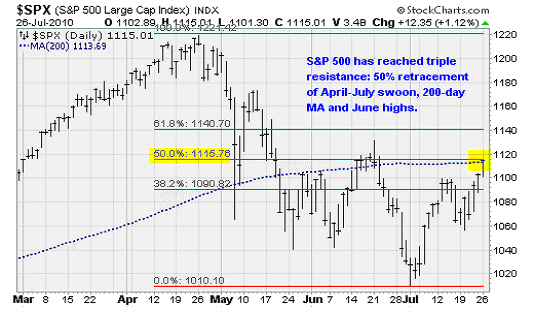
The remaining obstacles: Closing at 1,101 but touching 1,115 midweek, the benchmark index hit the 50% retracement of its April-July swoon, as shown above, and the June highs. That's a lot of resistance that has triggered kneejerk selling by powerful technical and algorithmic traders. A pause is now underway until the next leg of the advance gets going. I've been telling you that this is the level where push comes to shove. Closing three to five consecutive days over 1,115 would be the great show of force by the bulls that will cause bears to cover, but don't count the sellers out yet.
Russell 2000 stocks continue to perk up and demonstrate relative strength -- a positive sign that risk appetites are returning after a long and painful fast. After lagging the broad market from April until earlier this month, the smallest, riskiest stocks have turned things around over the last five trading sessions. Over this time, the Russell 2000 gained 4.7 percentage points over the Dow, the best five-day run since the initial rise out of the March 2009 low. Periods of small cap outperformance tend to mark uptrend initiations. There's no reason to think this time will be any different, though there may be a short span of consolidation first.
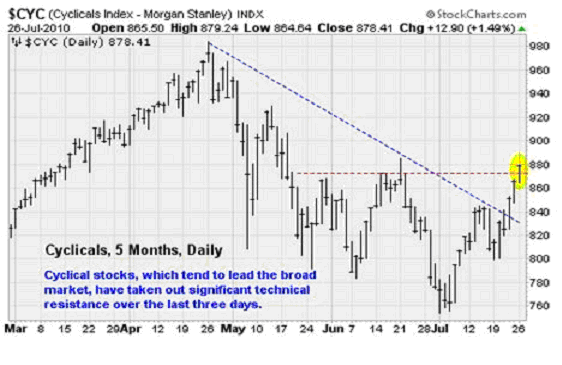
At the sector level, we noted impressive moves in high-beta, cyclical companies including consumer discretionary, real estate, retail, and housing. Stocks in these sectors were among the most hated during the post-April selloff as investors flocked to the safety of defensive non-cyclicals like utilities. But it now appears that brave bargain hunters are entering the fray. And luckily for us, the utilities that populate my StrataGem portfolio this month have not been abandoned, as they rose sharply to new 22-month highs.
If you lump all the cyclical stocks together, you can see how the pattern of lower lows and lower highs that has contained stocks since April has been broken. The Morgan Stanley Cyclical Index, shown above, moved over its June high this week -- setting the stage for a test of the early May highs reached during the snapback rally that came after the May 6 flash crash. The index is made up of 30 stocks from 25 industries including autos, metals, paper, chemicals, and machinery.
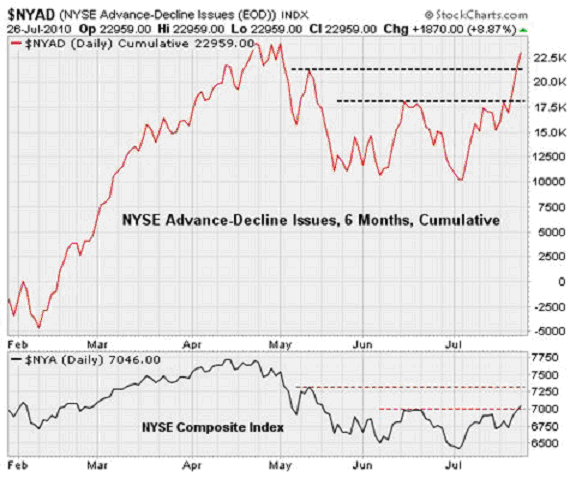
Breadth continued to improve Monday too, as a wider swath of the market participates in the advance. The NYSE Composite Index, shown in cumulative form in the chart above, has also moved above its June high and is now challenging its April high. This positive divergence with the underlying stock index suggests higher prices are ahead.
The takeaway: After a pause, the S&P 500 ought to be good for a run at least to resistance near 1,175, or a 5%+ move from here, unless some new exogenous elements interfere.
More than 150 earnings reports were released between Tuesday's close and Wednesday's open alone. The vast majority of these featured upside earnings surprises, but frankly investors were unimpressed, apathetic, or just overwhelmed by the sheer volume of earnings news hitting the wires. Just look at the way The Boeing Co. (NYSE: BA) was treated: It reported earnings per share five cents above expectations, but was pushed 1.5% lower on weak revenues and unchanged forward guidance.
So here's the reason for the pause: people are simply tired of buying. While this seems over simplistic, there is an important takeaway here. According to the supply and demand measures maintained by Lowry Research Corp., the selling pressure of mid-week was the result of a decline in demand rather than a big increase in selling pressure. In other words, instead of a full frontal assault by sellers, stocks are falling because buyers decided to take a step back.
Can't say I blame them. The 14 trading days through Monday -- before the recent selloff began -- represented the best stretch of performance for stocks since last summer. And much of that gain came within the last six sessions. Breadth improved dramatically as a wide swatch of the market was bid higher. That's a lot of heavy lifting over a relatively short span. A break is in order.
Cautions? Sure. Remember that this is the time in the quarter when bears have caused their most mischief in the past nine months: The first week of the second month of the quarter. Stay on your toes.
Credit Derivatives Trading Calms Down
Still, there is plenty of good news to support higher prices over the horizon. Company sales surveys conducted by the ISI Group Inc. rose by the largest amount in four months last week. Job gains look set to continue into the second half of the year. Business confidence is up in Germany. Employment is rising at a 3% annual rate in Taiwan. And exports are surging in Japan and South Korea.
Another important positive is that the level of stress in the government debt market is subsiding. Evidence: The market for credit derivatives based on sovereign debt is calming down. By one measure, the situation has returned to levels last seen in early April.
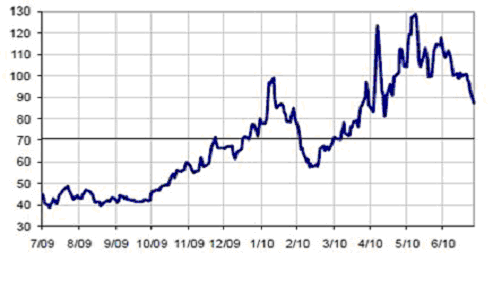
This is based on the CDR Government Risk Index maintained by the folks at Credit Derivatives Research, which is based on the credit default swaps of seven nations including Germany, Spain and Italy. After spiking higher during the 2008-2009 credit crisis, and again during the recent sovereign debt crisis, the index, shown above, has been sliding lower over the last two weeks -- falling out of the range that had held the measure since May.
I focused on the CDR Government Risk Index in November 2009, when I highlighted the looming problem of rising fiscal deficits and the ability of deeply indebted nations to pay down ballooning debts. This was well before people were talking about troubles in Greece or Dubai. At the time, I wrote:
But now, unfortunately, trouble is brewing. The first early warning comes from the credit derivatives market. This is the wild west of financial markets -- fast growing, unregulated, and not tied to organized exchange like the NYSE. It is here that credit default swaps or "CDS" trade. These are basically insurance contracts that protect debt holders against the failure of bond issuers to return principal.
This could set the stage for another panic at some point next year not unlike the credit crisis of 2008. Then, financial CDS spiked higher and spooked equity investors, creating a selling panic that in many ways was totally unnecessary. If the rising trend in sovereign CDS continues we should interpret this as the market preparing for a rise in the general risk level.
Just as I warned you of trouble back then, today I am pleased to highlight the strengthening underway in the CDS market. If it continues, then risky assets like equities should find plenty of price support in the weeks and months to come.
European Stress Relief
While the European bank stress tests last month were far from perfect, they did shine some light in an area where there was murkiness. Because of the tangled web of bank regulators in the Eurozone, investors didn't have much insight into which banks were strong, which were weak, and which were on the verge of collapse. With a dearth of information, bank stocks in particular and European equities in general were hammered in April and May.
But now perceptions have changed. The tests were certainly too lenient, but some of the fear of total rot on the books of European banks has been lifted. And as a result, stocks in Europe are moving higher. Of the 91 banks tests, only seven failed (mostly smaller Spanish thrifts) and 12 barely scraped through (including Allied Irish Bank (NYSE ADR: AIB) and Germany's Deutsche Postbank AG (ETR: DPB).
The total capital shortfall and the banks that failed amounted to $4.5 billion and investors are showing a willingness to help fill the gap. JC Flowers & Co., a U.S.-based buyout firm, put $580 million dollars into Civica, a Spanish bank that failed the test. This is a fantastic sign of confidence and marks the first time one of the Spanish "cajas" -- institutions much like U.S. savings and loans -- sought outside capital.
There was other good news out of Europe this week, helping to dissipate some of those double-dip concerns for now.
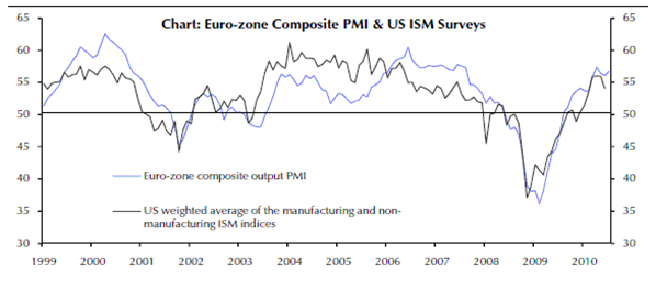
The Eurozone composite purchasing managers' index increased from 56.0 to 56.7 -- far better than the consensus estimate of a drop to 55.2. You can see the tiny hook up in the blue line on the chart above. The improvement was driven by strength in manufacturing and services. This is a sign that the improvement in economic activity is spreading from export-oriented industries to domestically focused services businesses. The result also marked the eighth consecutive monthly rise in the employment index as new jobs are created.
In Germany, business confidence reached a three-year high as a "party mood" spread throughout the country according to Hans-Werner Sinn, president of the Ifo Institute which conducts the survey. The business climate survey increased to 106.2 from 101.8 in June -- the largest increase recorded since German reunification in 1990. The German stock market, the DAX Composite, is within a fraction of its April high. The decline in the value of the euro, making German exports cheaper, is working its magic.
In Italy, the Institute for Studies and Economic Analyses (ISAE) research institute of Italian consumer confidence increased to 105.6 for July from 104.5. This was well above analyst expectations for a drop to 103.9. And this came in the midst of the European debt crisis and shaky global markets. Think about where confidence can go now that some of fear has passed. Now perhaps markets can climb the proverbial wall of worry.
In the United Kingdom, the economy expanded by 1.1% in Q2 -- nearly twice as quickly as economists expected. This represents the best growth in four years. The increase was due to broad-based strength, with the manufacturing, services, and construction sectors all participating.
While there is certainly the potential for a renewed slide in business activity and confidence should the European sovereign debt situation suffer another setback, for now things are looking up.
Week In Review
Monday: New home sales made a surprising jump in June, up 330,000 compared to the prior month's result of 300,000 and the consensus estimate of 310,000. Recent housing data points to some stabilization in the wake of the expiration of the government's homebuyer tax credit.
Tuesday: Home prices jumped 1.2% in May as the housing market enters a period of seasonal strength with affordability at attractive levels thanks to ultra-low mortgage rates. Consumer confidence continued to slip, falling to 50.4 in July from 52.9 previously and 63.3 in May as worries over income and jobs dominate. A number of materials stocks, including United States Steel Corp. (NYSE: X) and Century Aluminum Co. (Nasdaq: CENX) reported weaker-than-expected earnings.
Wednesday: Durable goods orders slipped by 1% in June when a 1% increase was expected. Transportation was a big drag, with nondefense aircraft falling 25.6%. Durable goods orders can be a volatile measure -- the important thing is that the overall trend remains positive.
Thursday: Initial weekly jobless claims fell more than expected for the July 24 week -- coming in at 457,000 versus the 460,000 estimate. Consumer staples stocks Colgate-Palmolive Co. (NYSE: CL) and Kellogg Co. (NYSE: K) disappointed investors with their quarterly earnings and were punished. K posted its largest one-day loss since 2008 while Colgate suffered its biggest fall since 2004. Exxon Mobil Corp. (NYSE: XOM) beat analysts' expectations on a 24% increase in revenues.
Friday: The Q2 gross domestic product (GDP) growth numbers showed the economy slowed a bit more than anticipated -- expanding 2.4% versus the 2.5% consensus estimate and the upwardly revised Q1 gain of 3.7%. The result isn't bad when you consider the drag on sentiment during the period caused by the European debt crisis. The release included revisions for GDP growth going back three years. The result: The recession was deeper than previously thought and the subsequent recovery shallower.
There was however some positive news suggesting economic recovery is becoming more sustainable, even if its growth rate is slowing. If you strip out inventories and energy imports, which gives you a much clearer view of the core economy, you can see that the growth rate of "final sales to domestic purchasers," which is a measure of business investment, actually accelerated to 4.1% in the second quarter, from 1.3% in the first quarter and just 0.2% in the fourth quarter of 2009. A lot of analysts believe that this is a better measure of the economy's underlying strength, and I agree.
Separately, the Chicago Business Barometer showed an uptick in activity in the Midwest, rising to 62.3 compared to the consensus estimate of 56 and the previous result of 59.1. Measures of new orders, order backlogs, and employment all expanded -- setting the stage for a strong ISM manufacturing report next week. Drug giant Merck & Co., Inc. (NYSE: MRK) reported better-than-expected results on a 92% increase in revenues. Chevron Corp. (NYSE: CVX) also posted impressive results.
The Week Ahead
Monday: The ISM Manufacturing Index is expected to slip slightly to 54 in July from 56.2 previously. Still the Chicago Business Barometer made a surprise jump, which could presage a similarly unexpected jump for the ISM manufacturing report.
Tuesday: A busy day, with motor vehicle sales, personal income, factory orders, and pending home sales all being reported. Watch the income report to see if recent gains to wages and salaries can continue. Incomes jumped 0.4% in May and 0.5% in April. A number of utilities, including Duke Energy Corp. (NYSE: DUK), report results.
Wednesday: The ISM Non-Manufacturing Index is expected to come in at 53 compared to the period result of 53.8. There has been some weakening in the measure of health for the important services sector as the European debt crisis weighed on sentiment, but the recent Chicago Business Barometer -- which measures both manufacturing and non-manufacturing activity -- suggests a rebound in activity is underway. The Boeing Co. (NYSE: BA) reported lukewarm results, beating on earnings but reporting a drop in revenue.
Thursday: Initial weekly jobless claims should continue to improve and are expected to fall to 455,000. Also, chain store sales figures for the month of July will be released.
Friday: The big July employment situation report will provide an update on the unemployment rate and payrolls. The hiring and firing associated with the 2010 Census has distorted recent reporting. The effect is expected to continue this time around, with nonfarm payrolls expected to fall by 70,000 due to the loss of government workers. There were some 339,000 temporary workers on the Census payroll in June, and these workers will eventually need to be let go. Eliminating this influence, private payrolls are expected to expand by 100,000.
[Editor's Note: Money Morning Contributing Writer Jon D. Markman has a unique view of both the world economy and the global financial markets. With uncertainty the watchword and volatility the norm in today's markets, low-risk/high-profit investments will be tougher than ever to find.
It will take a seasoned guide to uncover those opportunities.
Markman is that guide.
In the face of what's been the toughest market for investors since the Great Depression, it's time to sweep away the uncertainty and eradicate the worry. That's why investors subscribe to Markman's Strategic Advantage newsletter every week: He can see opportunity when other investors are blinded by worry.
Subscribe to Strategic Advantage and hire Markman to be your guide. For more information, please click here.]
Source : http://moneymorning.com/2010/08/02/wall-street-3/
Money Morning/The Money Map Report
©2010 Monument Street Publishing. All Rights Reserved. Protected by copyright laws of the United States and international treaties. Any reproduction, copying, or redistribution (electronic or otherwise, including on the world wide web), of content from this website, in whole or in part, is strictly prohibited without the express written permission of Monument Street Publishing. 105 West Monument Street, Baltimore MD 21201, Email: customerservice@moneymorning.com
Disclaimer: Nothing published by Money Morning should be considered personalized investment advice. Although our employees may answer your general customer service questions, they are not licensed under securities laws to address your particular investment situation. No communication by our employees to you should be deemed as personalized investent advice. We expressly forbid our writers from having a financial interest in any security recommended to our readers. All of our employees and agents must wait 24 hours after on-line publication, or 72 hours after the mailing of printed-only publication prior to following an initial recommendation. Any investments recommended by Money Morning should be made only after consulting with your investment advisor and only after reviewing the prospectus or financial statements of the company.
Money Morning Archive |
© 2005-2022 http://www.MarketOracle.co.uk - The Market Oracle is a FREE Daily Financial Markets Analysis & Forecasting online publication.