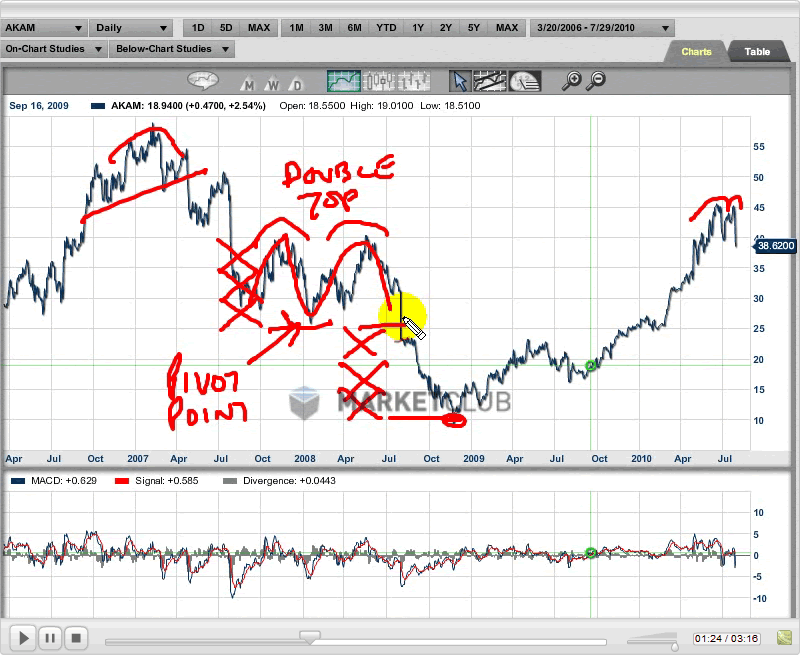
We Analyze Akamai Technologies AKAM Classical Technical Pattern
Companies / Company Chart Analysis Jul 30, 2010 - 09:40 AM GMTBy: INO
 This stock looks lower based on a classical technical pattern
This is the first time I have looked at this particular stock and it appears to chart beautifully. The stock I am referring to and analyzing today is Akamai Technologies Inc. The symbol for this stock is AKAM and it is traded on the NASDAQ.
In this short video I share with you a classic chart pattern that I've seen thousands of times before in different markets. The pattern is very reliable and seems to work well most of the time. Some people believe in this type of technical analysis, however, some folks feel that it may as well be voodoo.
For myself, I believe that history and markets repeat themselves based on human nature, which has not changed in thousands of years.
Whether you like or dislike this video, please feel free to comment.
The video is with our compliments and there is no need to register in order to watch.
Enjoy the video and all the best,
Adam Hewison
President, INO.com
Co-creator, MarketClub
By INO.com
INO and Quote Providers furnish quotes and market analysis without responsibility for accuracy and is accepted by the site visitor on the condition that transmission or omissions shall not be made the basis for any claim, demand or cause for action. The information and data was obtained from sources believed to be reliable, but we do not guarantee its accuracy. Neither the information, nor any opinion expressed, constitutes a solicitation of the purchase or sale of any futures or options..
INO Archive |
© 2005-2022 http://www.MarketOracle.co.uk - The Market Oracle is a FREE Daily Financial Markets Analysis & Forecasting online publication.


