Bullish Precious Metals, Crude Oil, and Gold Stocks
Commodities / Elliott Wave Theory Sep 16, 2007 - 01:44 AM GMT As the Fed hyperinflates, sacrificing the Dollar to bail out a deteriorating economy, precious metals and Gold stocks are benefiting. Gold and the HUI are close to bullish breakouts.
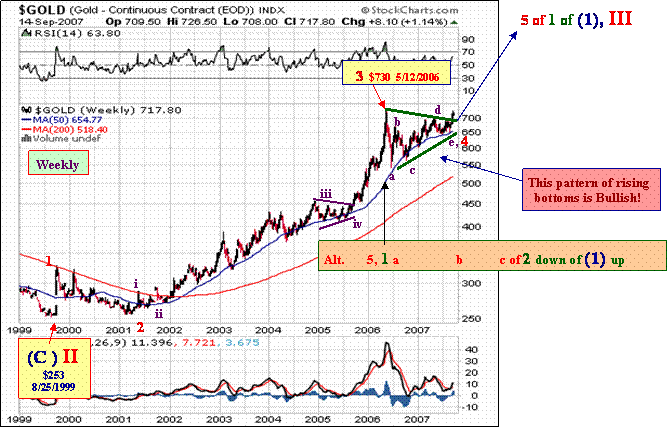
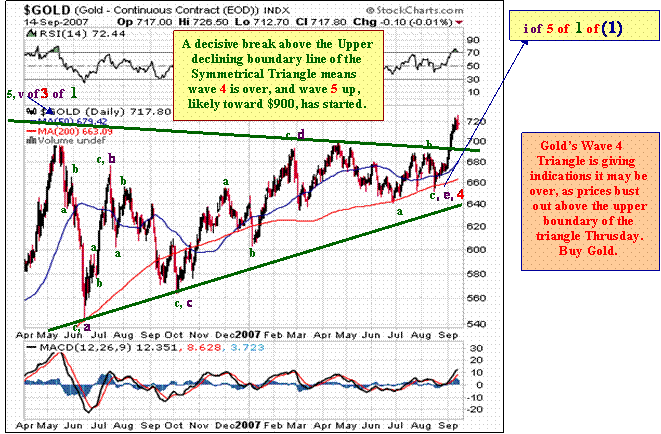
Gold finished the Minor degree wave 3 of Intermediate degree 1 up on May 12th at $730.40. Gold 's Minor degree wave 4 is a Symmetrical Triangle , which is a consolidation pattern of the Minor degree wave 3 rally that started back in 2001 and extended into the May 12th, 2006 top. Waves a through e within wave 4 are complete. A break above $730 would confirm that the triangle is complete, and wave 5 up is underway, and would be a “buy” signal. We came close to that level this past week.
A 50 basis point drop in the Fed Funds interest rate should provide a burst of wind behind Gold's ascension, and likely drive it above $730 within a few weeks . Wave fives typically extend with precious metals, so for wave 5 , $900 is not out of the realm of possibility for Gold in 2008. We believe the upside breakout is imminent, so we are comfortable taking additional Gold positions at this time.
Silver's performance is lagging Gold's since Silver has industrial use, and the stock market's dive is forecasting a slowing economy, which suggests industrial demand for silver may slow. However, Silver also has monetary value, so its downside should be limited.
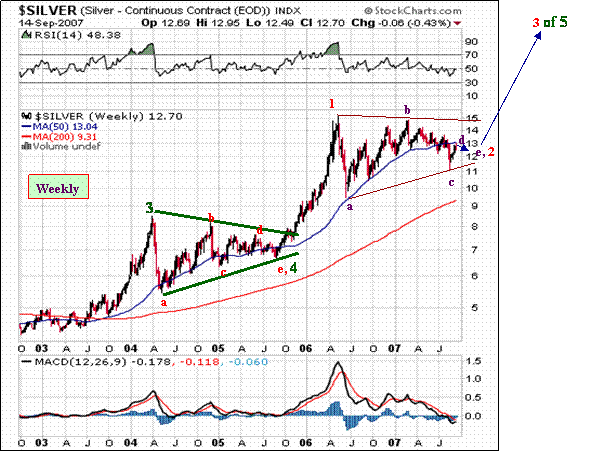
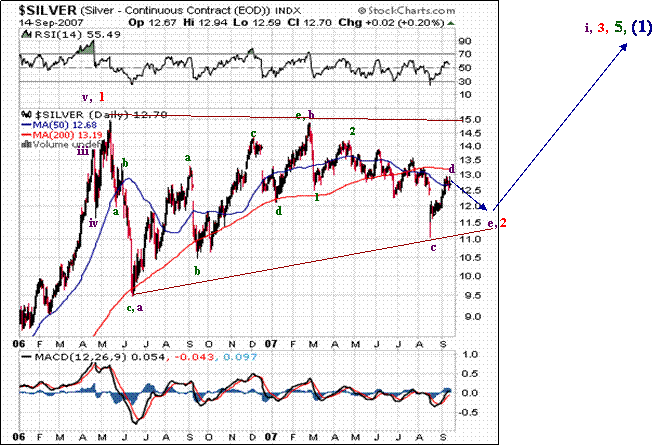
Silver finished its Minor degree wave 1 up, and it appears an Ascending Bullish Triangle is back in the picture. An alternate which is that the pattern has morphed into a wave 2 -down a-b-c flat, with a truncated wave c- down. Not crazy about that labeling, but is a possibility at this time. It may have more downside left before a huge rally unfolds. A decisive breakout above 15 would confirm that wave 3 up of 5 up is underway.
Once Silver rises above $15, then it is off to the races toward $21 as wave 3 of 5 up kicks in. Wave fives typically extend in precious metals, a solid reason Silver could be headed for $21.
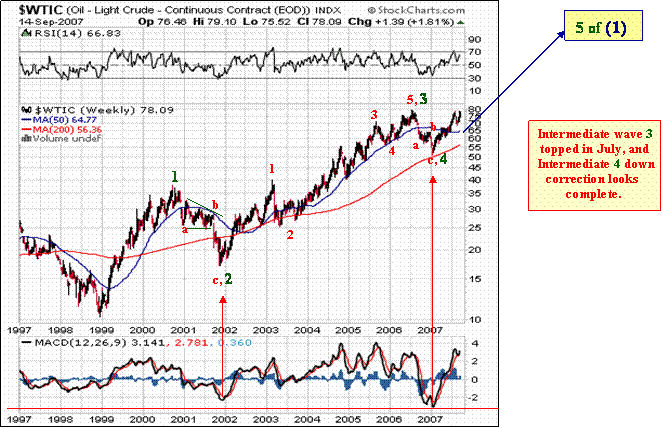
Above, we present the long-term Elliott Wave labeling for Oil (West Texas Intermediate Crude). It finished a huge Intermediate degree wave 3 bull market in July, 2006. The decline since was corrective Intermediate wave 4 down . Wave 4 down is finished, and wave 5 up has started, with oil up 60 percent over the past five months . Within wave 5 up, wave i of 1 up is complete, as is corrective wave ii down. Oil hit $80 a barrel this week. We've been predicting since January 2007 when oil hit the low 50's that “This huge wave 5 up should take oil above $80 a barrel this year.” Wave 5's typically extend in commodities.
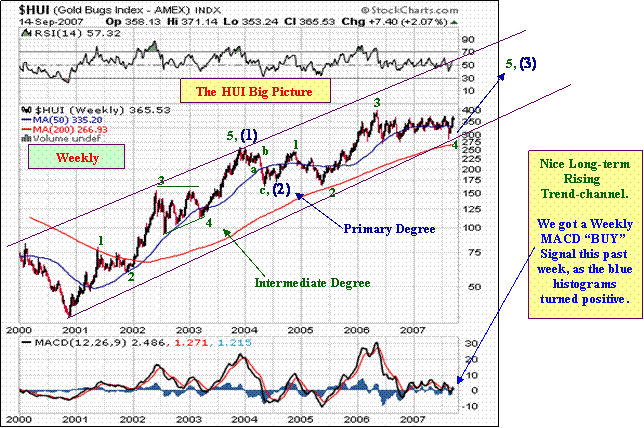
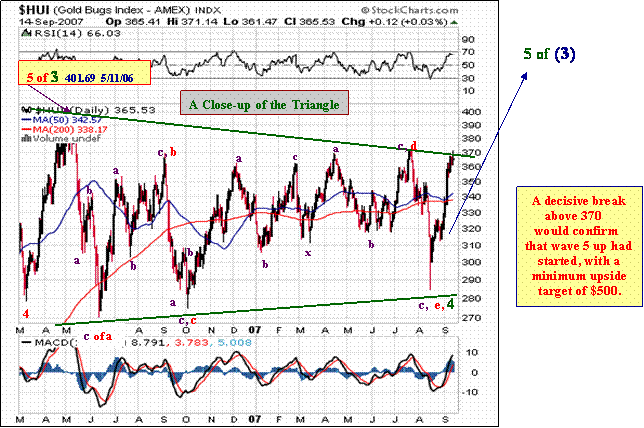
While short-term, the HUI was following the general market, the divergence we've been expecting appears to have arrived, and the HUI looks Bullish at this time. Once the major stock indices finish their coming wave 2 correction, both the HUI and major stock averages should again both rise sharply together. The HUI bounced sharply from its latest down-leg to complete its one-year-old Symmetrical Triangle pattern . This pattern is a continuation pattern, meaning the direction of prices going into the pattern will be the same once the pattern completes — in this case up . The key here is to watch for an upside breakout above 370ish. That would signal a major rally is unfolding. We came close last week.
Confirmation that wave 5 up has started came this week when the Weekly MACD generated a “buy” signal by having its blue histograms turn positive . Further confirmation that 4 down is over would come with a rise above 401. Wave 5 up should hit at least the 500 area, with higher potential.
For a Free 30 day Trial Subscription , go to
www.technicalindicatorindex.com and click on the button
at the upper right of the Home Page.
“Jesus said to them, “I am the bread of life; he who comes to Me
shall not hunger, and he who believes in Me shall never thirst.
For I have come down from heaven,
For this is the will of My Father, that everyone who beholds
the Son and believes in Him, may have eternal life;
and I Myself will raise him up on the last day.”
John 6: 35, 38, 40
by Robert McHugh, Ph.D.
technicalindicatorindex.com
If you would like a Free 30 day Trial Subscription , simply go to www.technicalindicatorindex.com , and click on the FREE Trial button at the upper right of the home page. A subscription gains you access to our buy/sell signals, our Market Analysis Newsletters, Traders Corner, our model Conservative Investment Portfolio, Guest Articles, and our Archives.
Robert McHugh Ph.D. is President and CEO of Main Line Investors, Inc., a registered investment advisor in the Commonwealth of Pennsylvania, and can be reached at www.technicalindicatorindex.com. The statements, opinions, buy and sell signals, and analyses presented in this newsletter are provided as a general information and education service only. Opinions, estimates, buy and sell signals, and probabilities expressed herein constitute the judgment of the author as of the date indicated and are subject to change without notice. Nothing contained in this newsletter is intended to be, nor shall it be construed as, investment advice, nor is it to be relied upon in making any investment or other decision. Prior to making any investment decision, you are advised to consult with your broker, investment advisor or other appropriate tax or financial professional to determine the suitability of any investment. Neither Main Line Investors, Inc. nor Robert D. McHugh, Jr., Ph.D. Editor shall be responsible or have any liability for investment decisions based upon, or the results obtained from, the information provided. Copyright 2007, Main Line Investors, Inc. All Rights Reserved.
Robert McHugh, Ph.D Archive |
© 2005-2022 http://www.MarketOracle.co.uk - The Market Oracle is a FREE Daily Financial Markets Analysis & Forecasting online publication.


