Stocks Mixed, Consolidation Session
Stock-Markets / Stock Markets 2010 Jul 28, 2010 - 03:07 AM GMTBy: Harry_Boxer
 The stock market indices started out with a bang, gapping up and running to new rally highs that touched 1900 on the Nasdaq 100 and near 1121 on the S&P 500. They then had a strong 3-wave sell-off after the Consumer Confidence Index came out negatively, dropping to 1880 on the NDX and 1110 on the SPX.
They bounced, took back about 50% of the losses, and then retested. When that was successful, they managed to firm up in the afternoon, but in the last half hour they pulled back once again and closed narrowly mixed on the session.
Net on the day, the Dow was up just 12.26 at 10,537.69, the S&P 500 was down 1.17 at 1113.84, and the Nasdaq 100 was down 1.54 at 1888.81.
Advance/declines, however, were negative by 360 issues on the New York Stock Exchange, and by about 380 issues on Nasdaq. Up/down volume was about 6 to 5 negative on New York with total volume of 1.1 billion. Nasdaq was about 2 to 1 negative with total volume of just under 2 billion.
Charts of the Day:
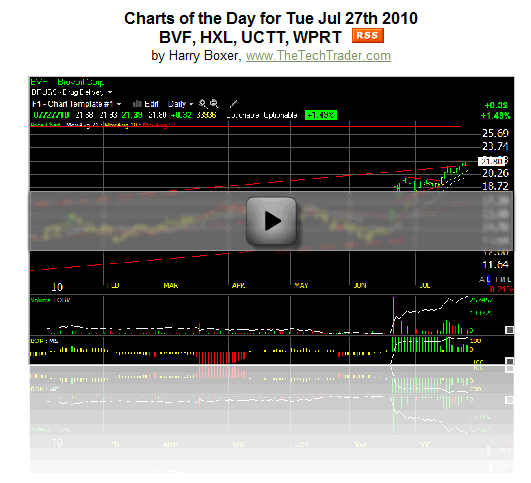
Biovail Corporation (BVF), a drug delivery company, exploded in June, then formed a beautiful wedge, or coil, broke out, and has been making literally new highs every day. The weekly chart shows this stock has been in a beautiful rising channel for the last couple years, and there's overhead resistance coming up around the 27 1/2 - 28 zone, our initial target. Longer-term target is around the mid 30s. Certainly Biovail looks like it has momentum, volume, and technicals surging. Even though it's near the top of the channel, it seems to want to move higher, and we'll be looking for that 27-28 zone.
Hexcel Corp. (HXL), which has been moving up steadily, particularly since February when it was just under 10, is now nearly double that. Over the course of the prior 3 months it had a nice consolidation going until it reached a breakout. This stock continues to edge higher while the market grinds. I think this is a stock that has potential to be at much higher levels. Short-term target around the 24 level, secondary target around 28.
Ultra Clean Holdings Inc. (UCTT), a junior semiconductor, broke out of a 3-4 month wedge today. Previously, the stock had run from under 1 up to under 11, a 10-fold increase, and it's finally gone into a more lengthy consolidation, but in the last week or so has popped from 8 to a 10.87 high today. Short-term trading target is at 12-12 1/4, intermediate target at 15.
Westport Innovations Inc. (WPRT) continues to look excellent, a beneficiary of the clean air bill in Washington. More importantly, the stock, which has been in a beautiful uptrend since it was 3, is now back over 20, reaching over 21 today. It's making new multi-year highs. The top of the channel is my trading target at 24 - 24 1/2.
Reviewing our Watchboard:
TheTechTrader.com board was mostly lower today by about 2 to 1. Leading the way to the upside was Apple Inc. (AAPL), up 4.80 at 264.08, and Google Inc. (GOOG), up 3.66 at 492.63.
The only other point-plus gainer on the board was Transocean Ltd. (RIG) up 1.10 at 47.17.
Fractional gainers were mostly very small fractional and not much to speak of.
On the downside, Amazon.com Inc. (AMZN) lost 1.27 to 117.13, Cree Inc. (CREE) 2.60 at 73.03, Dendreon Corp. (DNDN) 1.58 to 34.86, IDT Corporation (IDT) 1.19 to 17.63, and OmniVision Technologies Inc. (OVTI) 1.15 to 24.35.
In addition, junior solar Trina Solar Ltd. (TSL) was down 1.20 at 23.05.
Stepping back and reviewing the hourly chart patterns, the indices gapped up at the opening, sold off sharply in the morning, and then bounced around, vacillating in a fairly narrow range on the SPX and a little wider on the NDX. Nevertheless, it was a mixed day, more of a consolidation-type day, but support managed to hold despite the appearance of what looks like 2-day head-and-shoulders tops forming.
We'll see which way they go tomorrow.
Good Trading!
Harry
For more of Harry Boxer, sign up for a FREE 15-Day Trial to his Real-Time Technical Trading Diary. Or sign up for a Free 30-Day Trial to his Top Charts of the Week service.
(c) 2010 AdviceTrade, Inc. All rights reserved. Distributed only by written permission of AdviceTrade and The Technical Trader at info@advicetrade.com . In using any portion of Harry Boxer's content, you agree to the terms and conditions governing the use of the service as described in our disclaimer at http://www.thetechtrader.com
Mr. Boxer's commentaries and index analysis represent his own opinions and should not be relied upon for purposes of effecting securities transactions or other investing strategies, nor should they be construed as an offer or solicitation of an offer to sell or buy any security. You should not interpret Mr. Boxer's opinions as constituting investment advice. Trades mentioned on the site are hypothetical, not actual, positions.
Harry Boxer Archive |
© 2005-2022 http://www.MarketOracle.co.uk - The Market Oracle is a FREE Daily Financial Markets Analysis & Forecasting online publication.


