Trap Like Pattern in VIX
Stock-Markets / Volatility Jul 27, 2010 - 01:19 PM GMTBy: Mike_Paulenoff
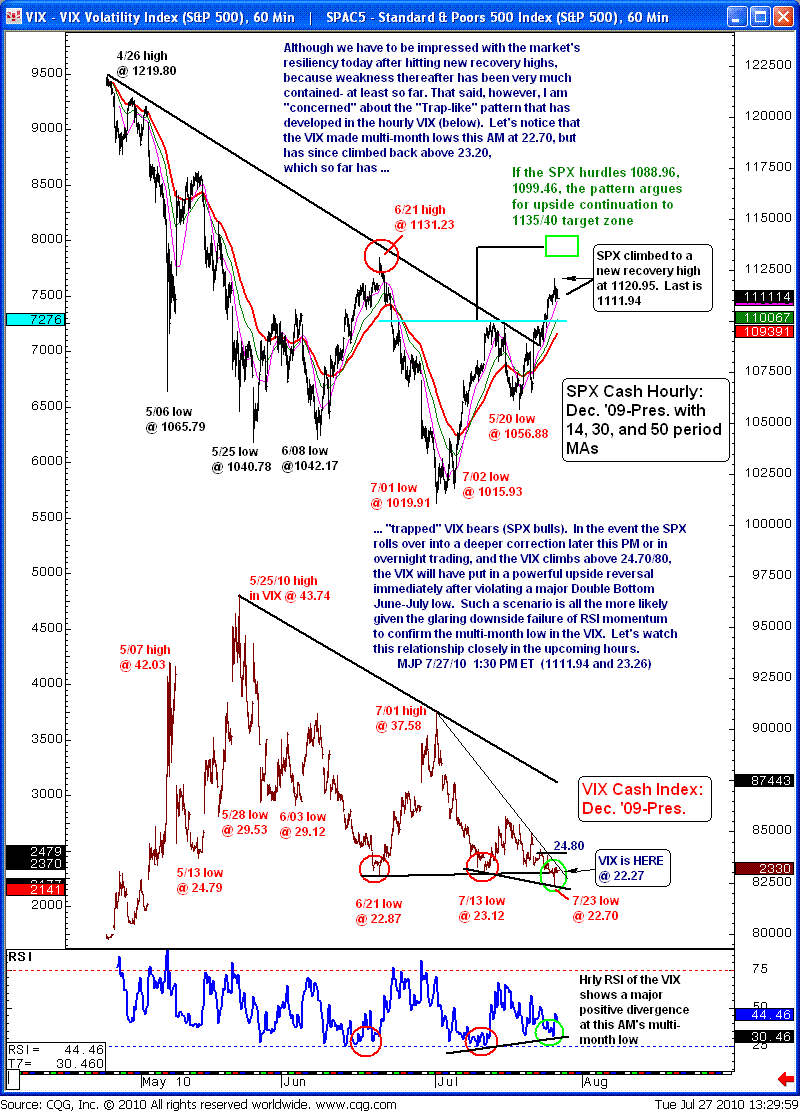
We have to be impressed with the market's resiliency today after hitting new recovery highs, because weakness thereafter has been very much contained, at least so far. That said, however, I am "concerned" about the "trap-like" pattern that has developed in the hourly Volality Index (VIX). Let's notice that the VIX made multi-month lows this morning at 22.70, but has since climbed back above 23.20, which so far has "trapped" VIX bears (SPX bulls).
In the event the SPX rolls over into a deeper correction later this afternoon or in overnight trading, and the VIX climbs above 24.70/80, the VIX will have put in a powerful upside reversal immediately after violating a major Double Bottom June-July low. Such a scenario is all the more likely given the glaring downside failure of RSI momentum to confirm the multi-month low in the VIX. Let's watch this relationship closely in the upcoming hours. MJP 7/27/10 1:30 PM ET (SPX 1111.94 and VIX 23.26)

Sign up for a free 15-day trial to Mike's ETF & Stock Trading Diary today.
By Mike Paulenoff
Mike Paulenoff is author of MPTrader.com (www.mptrader.com), a real-time diary of his technical analysis and trading alerts on ETFs covering metals, energy, equity indices, currencies, Treasuries, and specific industries and international regions.
© 2002-2010 MPTrader.com, an AdviceTrade publication. All rights reserved. Any publication, distribution, retransmission or reproduction of information or data contained on this Web site without written consent from MPTrader is prohibited. See our disclaimer.
Mike Paulenoff Archive |
© 2005-2022 http://www.MarketOracle.co.uk - The Market Oracle is a FREE Daily Financial Markets Analysis & Forecasting online publication.


