Stock Market Trending for Time Symmetrical Head and Shoulders Pattern with Fibonacci Support
Stock-Markets / Stock Markets 2010 Jul 27, 2010 - 03:55 AM GMTBy: JD_Rosendahl
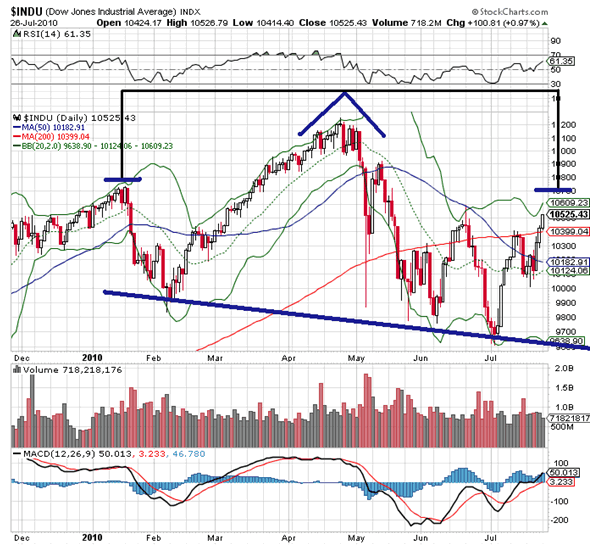
 It was another solid day for the DOW but I’m still trying to keep my positions light. If the right shoulder is to occur, I’ve got Friday or next Monday as potential turn days. The time between the 2007 high and the 2009 low is equal to the time between the March 2009 low and this Friday.
The time difference between the left shoulder and the head is 68 days or 34 * 2 (both Fibonacci numbers). 68 days from the head to the potential right shoulder is the following Monday. None of those require a market failure, but it does provide a window of opportunity.

I’m looking for some clues to confirm this pattern. Declining volume is the most obvious. Paraphrasing Bollinger on Bollinger Bands, ideally we want to see the right shoulder finish beneath the upper Bollinger Band.
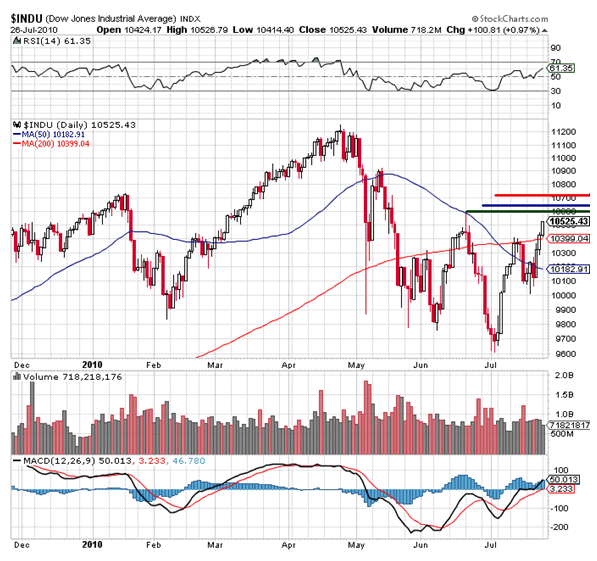
If it’s to be a right shoulder, I’ve labeled key pricing areas for this to occur in cluster resistance. The green line is the prior higher. The blue line is the 62% retracement level. The red line is the left shoulder.

I prefer the two later price areas (blue and red lines).
Why? I like the idea of Mr. Market placing maximum stress via fear and greed on bull and bear investors. If there’s one thing I do not like about the current head and shoulders pattern, it’s that every bear is trumpeting it as a certainty.
For our current watch list for trading opportunities on Big Caps and more speculative trading opportunities, please visit:
Hope all is well.
By J.D. Rosendahl
www.roseysoutlook.blogspot.com
J.D. Rosendahl was a former stock broker/investment consultant (currently not licensed) before becoming a Commercial Banker for the past 14 years. He manages his family's wealth, helping them avoid the high tech bubble and the real estate bubble melt downs and preserving wealth.
© 2010 Copyright J.D. Rosendahl - All Rights Reserved
Disclaimer: The above is a matter of opinion provided for general information purposes only and is not intended as investment advice. Information and analysis above are derived from sources and utilising methods believed to be reliable, but we cannot accept responsibility for any losses you may incur as a result of this analysis. Individuals should consult with their personal financial advisors.
© 2005-2022 http://www.MarketOracle.co.uk - The Market Oracle is a FREE Daily Financial Markets Analysis & Forecasting online publication.


