


Statistical View of Price Ranges for U.S. and China Stock Markets
Stock-Markets / Stock Markets 2010 Jul 24, 2010 - 02:51 PM GMTBy: Richard_Shaw

 The price range you might expect for a security is a function of your time frame and the volatility of the security. Investors with a 10-year time frame have a much different price range expectancy than an investor or trader with a 10-month, 10-week, 10-day or 10-minute time frame.
Let's look at volatility based price range possibilities for the US S&P 500 and the China FTSE Xinhua 25 over different time frames from the unique high of each in 2007, low in 2008 or 2009, YTD and from the most recent important high.
We used the actual S&P 500 index for the US stocks (close proxies are SPY, IVV and VFINX), and we used the iShares FXI as the proxy for the China stocks.
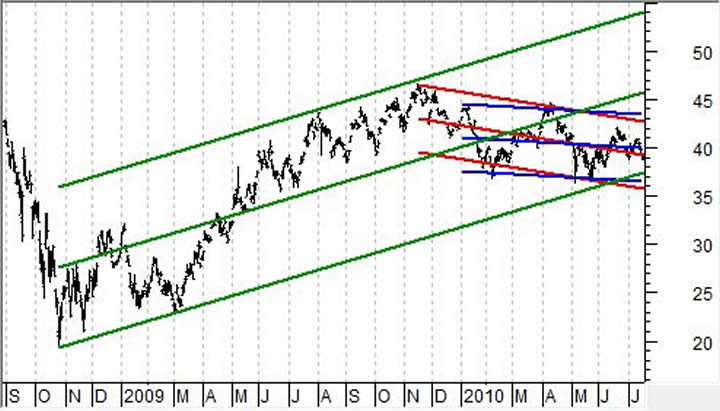
The charts below plot the best fit regression trend line for each period along with equidistant parallel lines describing a channel that is 2 standard deviations wide on each side -- encompassing about 96% of the prices that would be expected with the level of volatility generated during the period.
US Stocks:
The S&P 500 had its 2007 high in October, its 2009 low in March, and its most recent major high in April 2010.
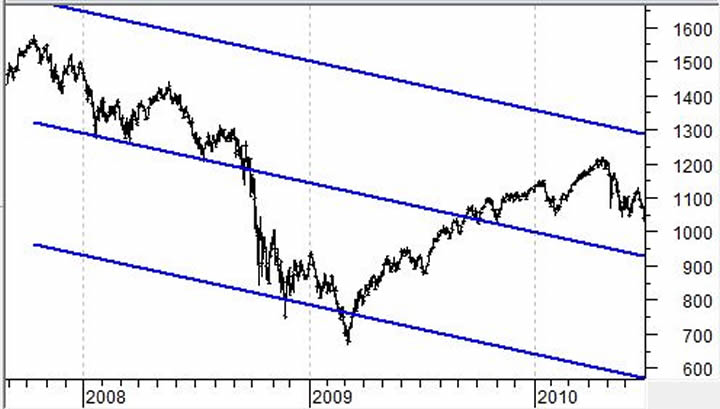
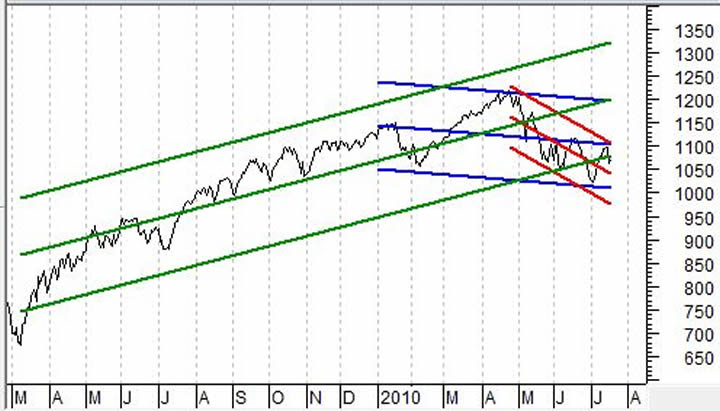
The current values of the best fit trend line, channel high and channel low for each time frame (presented as period label, trend line end-value and channel high and low values in parenthesis) are:
- from Oct 2007 High: 930 (1286 - 575)
- from Mar 2009 Low: 1202 (1320 - 1082)
- for 2010 YTD: 1103 (1197 - 1009)
- from April 2010 High:1043 (1107 - 981).
China Stocks:
FXI had its 2007 high in October, its 2008 low in October, and its most recent major high in November 2009.
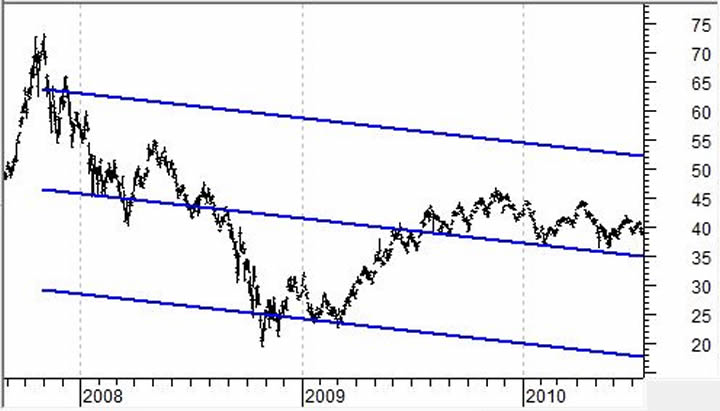
The current values of the best fit trend line, channel high and channel low for each time frame (presented as period label, trend line end-value and channel high and low values in parenthesis -- prices rounded to whole numbers) are:
- from Oct 2007 High: 35 (52 - 18)
- from Oct 2008 Low: 46 (54 - 38)
- for 2010 YTD: 39 (43 - 36)
- from Nov 2009 High: 39 (43 - 36)
Statistical ranges provide no guarantees, of course, but they are a factor to evaluate when making projections.
ETFs Cited: SPY, IVV, FXI
Holdings Disclosure: As of July 20, 2010, we do not own any securities mentioned in this article in any managed accounts.
By Richard Shaw
http://www.qvmgroup.com
Richard Shaw leads the QVM team as President of QVM Group. Richard has extensive investment industry experience including serving on the board of directors of two large investment management companies, including Aberdeen Asset Management (listed London Stock Exchange) and as a charter investor and director of Lending Tree ( download short professional profile ). He provides portfolio design and management services to individual and corporate clients. He also edits the QVM investment blog. His writings are generally republished by SeekingAlpha and Reuters and are linked to sites such as Kiplinger and Yahoo Finance and other sites. He is a 1970 graduate of Dartmouth College.
Copyright 2006-2010 by QVM Group LLC All rights reserved.
Disclaimer: The above is a matter of opinion and is not intended as investment advice. Information and analysis above are derived from sources and utilizing methods believed reliable, but we cannot accept responsibility for any trading losses you may incur as a result of this analysis. Do your own due diligence.
Richard Shaw Archive |
© 2005-2022 http://www.MarketOracle.co.uk - The Market Oracle is a FREE Daily Financial Markets Analysis & Forecasting online publication.