Upside Reversal for US Homebuilders?
Stock-Markets / Exchange Traded Funds Sep 15, 2007 - 11:30 AM GMTBy: Mike_Paulenoff
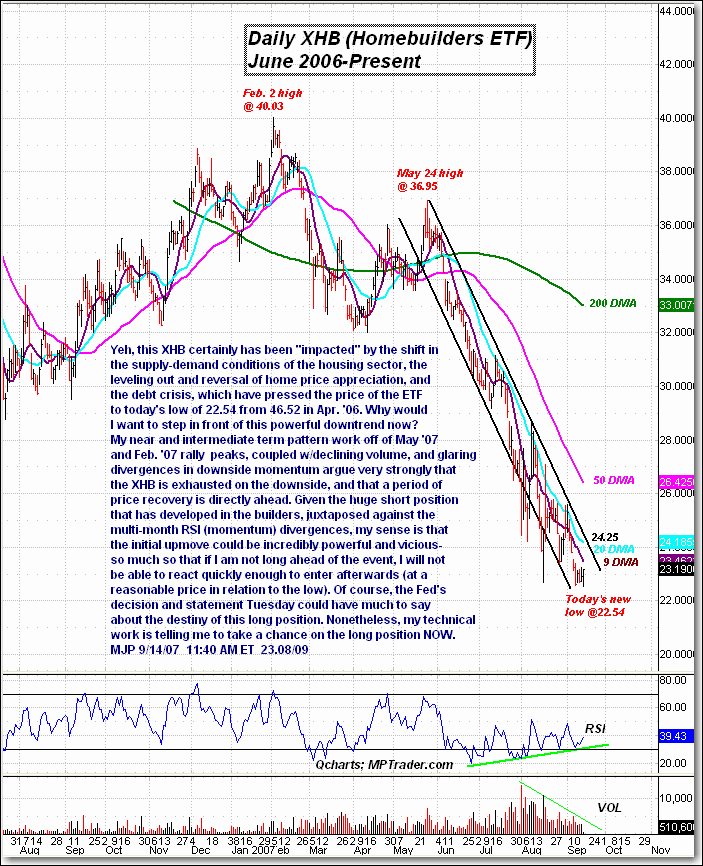
 The SPDR S&P Homebuilders ETF (Amex: XHB) certainly has been impacted by the shift in the supply-demand conditions of the housing sector, the leveling out and reversal of home price appreciate, and the debt crisis, which have pressed the price of the ETF to Friday's low of 22.54 from 46.52 in April 2006. Why would I want to step in front of this powerful downtrend now?
My near- and intermediate-term pattern work off of the May 2006 and February 2007 rally peaks, coupled with declining volume and glaring divergences in downside momentum, argue very strongly that the XHB is exhausted on the downside and that a period of price recovery is directly ahead. Please see the daily chart I posted for our subscribers mid-session on Friday.

Given the huge short position that has developed in the builders, juxtaposed against the multi-month RSI (momentum) divergences, my sense is that the initial upmove could be incredibly powerful and vicious -- so much so that if I am not long ahead of the event I will not be able to react quickly enough to enter afterwards (at a reasonable price in relation to the low). Of course, the Fed's decision and statement on Tuesday could have much to say about the destiny of this long position. Nonetheless, my technical work is telling me to take a chance on the long position now.
Keep in mind that although the XHB is called The Homebuilder ETF, it is composed of a cross-section of companies that contribute to the experience of building, refurbishing, furnishing, repairing, carpeting, and roofing a home... The largest component of the ETF is Champion Enterprises (NYSE: CHB) (7.2%), which constructs pre-fab houses. Next is Sherwin-Williams (NYSE: SHW) (6.8%), a manufacturer and distributor of paints. The third and fourth largest components are Lowe's (NYSE: LOW) (6.6%) and Home Depot (NYSE: HD) (6.4%), which are considered building material and supply companies. TOL is number 9 at 5%, PHM is number 12 at 4.2%, and LEN is number 14 at 4.2%.
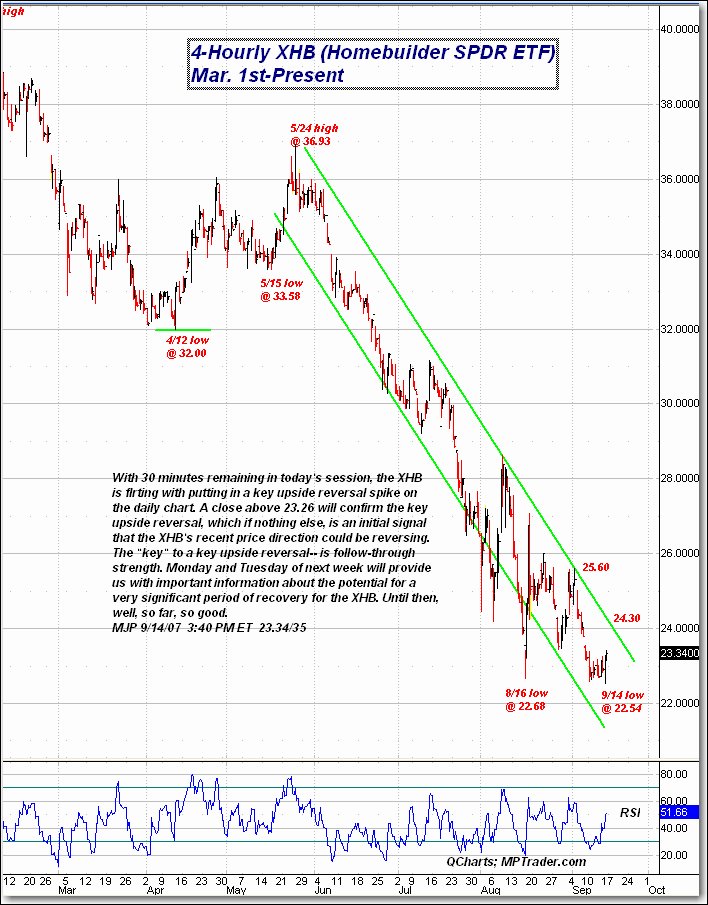
Towards the close of the session Friday, I posted another chart for subscribers, a 4-hour chart, that showed the progression in the chart since the earlier posting. I noted that close above 23.26 (which it accomplished) would confirm the key upside reversal and initial signal that the XHB's recent price direction could be reversing.
The "key" to the upside reversal is follow-through strength. Monday and Tuesday will provide us with important information about the potential for a very significant recovery for the XHB. Until then, so far so good.

Sign up for a free 15-day trial to Mike's ETF Trading Diary today.
By Mike Paulenoff
Mike Paulenoff is author of the MPTrader.com (www.mptrader.com) , a real-time diary of Mike Paulenoff's trading ideas and technical chart analysis of Exchange Traded Funds (ETFs) that track equity indices, metals, energy commodities, currencies, Treasuries, and other markets. It is for traders with a 3-30 day time horizon, who use the service for guidance on both specific trades as well as general market direction
© 2002-2007 MPTrader.com, an AdviceTrade publication. All rights reserved. Any publication, distribution, retransmission or reproduction of information or data contained on this Web site without written consent from MPTrader is prohibited. See our disclaimer.
Mike Paulenoff Archive |
© 2005-2022 http://www.MarketOracle.co.uk - The Market Oracle is a FREE Daily Financial Markets Analysis & Forecasting online publication.


