China Has a Painful Debt Bubble Surprise for the Global Economy
Economics / China Economy Jul 21, 2010 - 10:09 AM GMTBy: Claus_Vogt
 China implemented one of the world’s most aggressive economic stimulus programs to fight the recession of 2008. And the country went on something akin to a debt binge.
Credit growth surged as much 50 percent — an unprecedented peak. Such a policy can jump start an economy. But it lays the groundwork for imbalances and major bubbles.
Yes, I am aware that China is said to be different … but I don’t believe it!
Instead I’m fully convinced that even Chinese central planners cannot escape economic laws. Eventually the piper will have to be paid.
And payback time may be just around the corner as …
China’s Housing Bubble Continues to Inflate
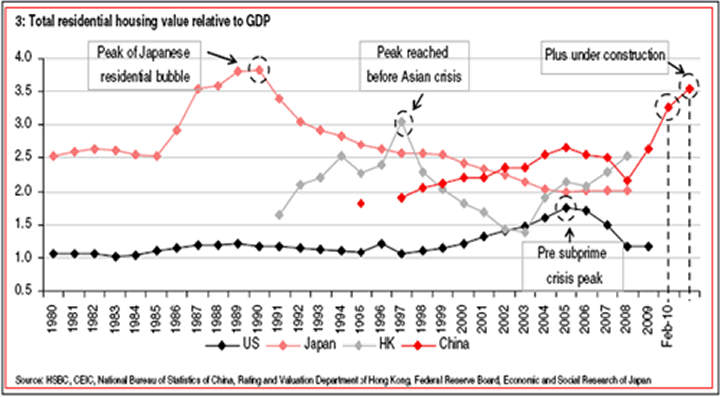
Recently I discovered the following chart published by international banking giant HSBC.
It compares the housing markets of Japan, the U.S., Hong Kong, and China. And it shows total residential housing value relative to GDP, which in my opinion makes for a good economic measure.
When you look at it, you’ll see a frightening picture developing …

First, there was the mother of all housing bubbles: Japan in the late 1980s. Total residential housing values reached a high of 3.8 times GDP. It burst shortly after the Japanese stock market bubble. Both markets subsequently fell by roughly 80 percent, and the economy has been in rough waters ever since.
Second, came the Hong Kong housing bubble with a peak valuation of 3.1 times GDP. It burst shortly before the Asian crisis began. Thanks to the economic ascent of mainland China, the aftermath of its bursting was relatively benign. But still, home prices and the stock market lost more than 50 percent before recovering.
Third, as you can see the U.S. housing bubble was rather small compared to its Asian peers. I don’t need to tell you what happened after this bubble burst. And neither the U.S. nor the world economy is out of the woods as of yet, quite to the contrary.
 |
| New homebuyers continue to fuel China’s frothy market. |
Finally, let’s look at what this chart is telling us about China. If this isn’t a huge housing bubble in the making, I don’t know what is! For the past two years this measure of home values in China has left its Hong Kong predecessor in the dust. Moreover, with a ratio of 3.5 it’s reaching Japanese-like stratospheric levels.
History tells us that bubbles are unsustainable — sooner or later they burst. And the bigger the bubble … the bigger the trouble is going to be. So the way I see it, the above chart sends a clear and loud message: China holds an unpleasant surprise for the world’s economies.
Has the Chinese Stock Market Already Sniffed Out Bubble-Trouble?
The Chinese stock market can be a good leading economic indicator …
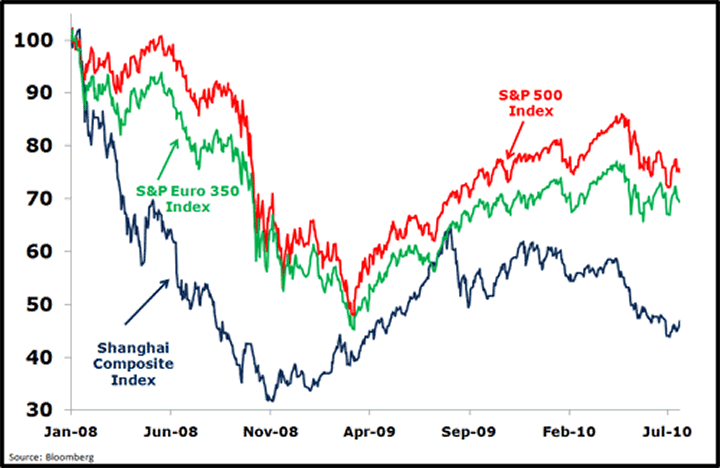
For example, as shown in the chart below, the Shanghai Composite Index was one of the first to end the huge bear market of 2008 when it bottomed in November that year. U.S. and European markets didn’t fall to new lows until March 2009.

As you can see, the Shanghai Composite Index made its high in August 2009. Then it meandered sideways until about three months ago when it started to decline in earnest.
This chart is convincingly bearish now. Investors are indeed worried. Combine it with a swelling Chinese housing bubble, and you can understand why I’m convinced the aftermath could be downright nasty for the global economy when the bubble finally pops.
Best wishes,
Claus
This investment news is brought to you by Money and Markets. Money and Markets is a free daily investment newsletter from Martin D. Weiss and Weiss Research analysts offering the latest investing news and financial insights for the stock market, including tips and advice on investing in gold, energy and oil. Dr. Weiss is a leader in the fields of investing, interest rates, financial safety and economic forecasting. To view archives or subscribe, visit http://www.moneyandmarkets.com.
© 2005-2022 http://www.MarketOracle.co.uk - The Market Oracle is a FREE Daily Financial Markets Analysis & Forecasting online publication.


