


SP-500 and GLD Time to Rally
Stock-Markets / Financial Markets 2010 Jul 21, 2010 - 08:10 AM GMTBy: John_Townsend

 At the time of my most recent article, we had just begun the stock market rally out of the July 2nd bottom and I suggested the rally would be able to continue higher, which it did, until the SP-500 1100 level stopped it on 3 consecutive days. Since then, we have taken 45 points off the index and today began a successful rally from 1057 that ended the day at 1083.
I have little doubt that the momentum generated today will soon yield another attempt to crack through 1100. However, I am skeptical that we will be able to get much higher than 1100 on this particular rally. Please, let me show you why.
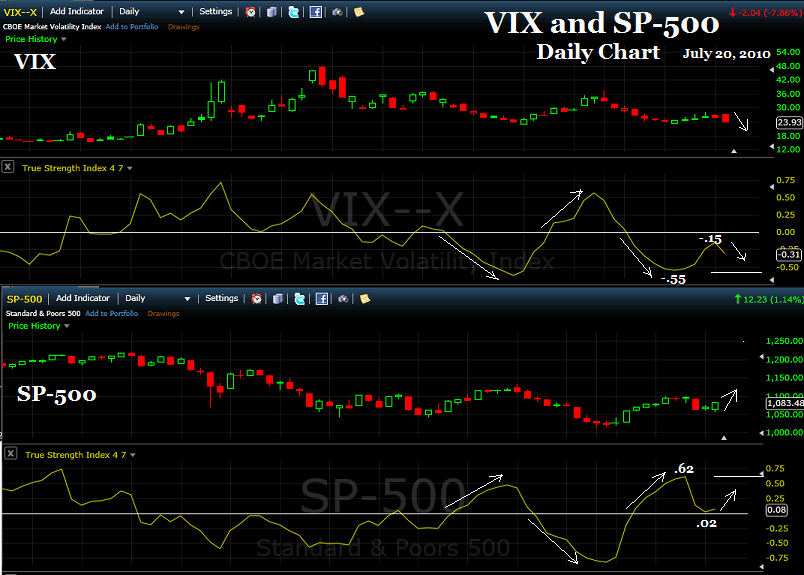
I use a momentum indicator, the True Strength Index (TSI) to generate buy and sell signals. One of the pre-cautionary techniques I employ is to anticipate divergences between price movement and the indicator’s movement. The following chart of both the VIX (Volatility Index) and SP-500 gives us a confirmation today that a rally is newly underway. Namely, the TSI indicator’s reading of the VIX has turned down and for the SP-500, it has turned up.
What the chart does not specifically tell you is that the SP-500, when it reaches 1100+ this time, is highly unlikely to also reach a TSI reading greater than its previous high of .62 This means that a new price higher than 1100 will be accompanied with a lower high reading of the TSI, thus creating an unfavorable divergence.
Likewise, the VIX low TSI reading of -.55 is unlikely to be surpassed with this rally. The next chess move, then, will be for the SP-500 to correct downwards after surpassing 1100, then try to overtake the TSI high it makes in the initial process of cracking 1100.
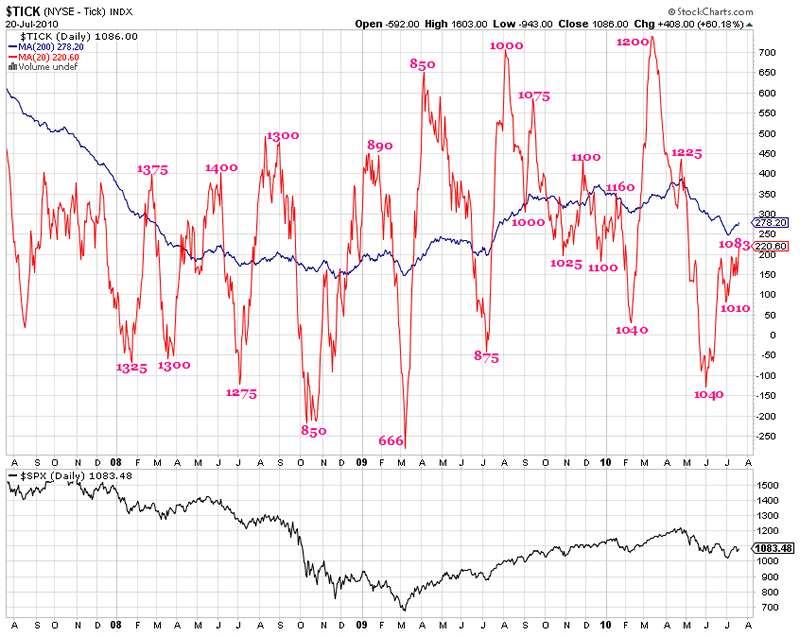
This next chart is of the $TICK and, like so many indicators I have reviewed recently, it shows us that we are not presently at one extreme reading (urgency to buy) or the other (urgency to sell). If you peruse the chart from left to right you will notice that as the tick drops, price drops. And as the tick rises, price rises.
Our current reading is near the $TICK indicator’s 200 dma, suggesting neutrality, but a longer term view suggests the $TICK is likely to complete its current pendulum swing (begun at SP-500 1010) by going to an extreme much higher – carrying price with it.
Gold was a little over $1210 when I last wrote to suggest it was going to have a difficult time climbing much higher until it first corrected. Indeed, with this morning’s low of $1175, gold has now corrected and looks poised to head higher with a stumble or two along the way.
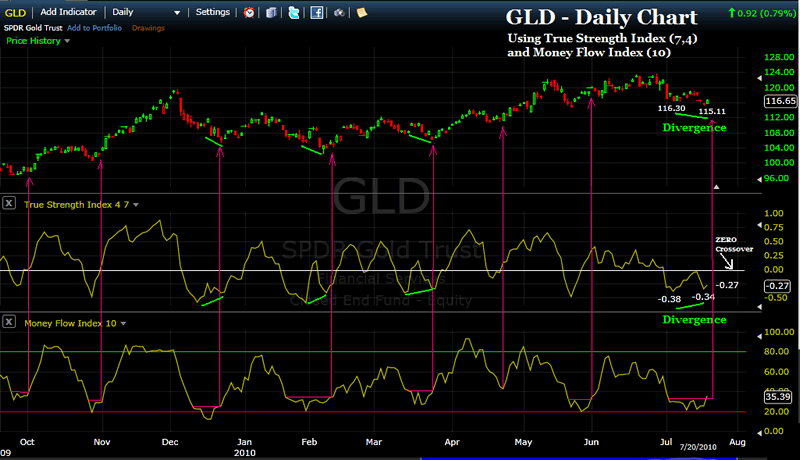
What follows is the daily chart of GLD. I am using two indicators below price action - the True Strength Index (TSI) and below that the Money Flow Index (MFI). What I have been looking for from each indicator was a specific condition to identify a potential bottom in gold price. With today’s action, both indicators gave the green light buy sign.
First, I was looking for the TSI to set up a positive divergence with price i.e. price makes a lower low while the indicator makes a higher low. That did happen with today’s positive action. The other thing I was looking for was MFI to take out its previous high and that is now in place, as well.
You will notice that TSI divergences (lime green) have correctly identified several of gold’s bottoms in the past. Also, the MFI technique I use (hot pink) has also been very effective in identifying recent bottoms in gold.
I am very concerned that today’s gold movement was not accompanied by high volume. And I believe today’s intra-day $1175 low was completed pre-market of opening trade in New York – so stock investors were treated to a rising gold price at the start of trade and really were never subjected to a plunge in price. Both these issues make me suspicious of this bottom, though my indicators certainly look favorable.
For now, I think the ZERO crossover that GLD needs to make on the TSI indicator is a critical piece in the short term. Currently at TSI -.27, it is very possible for gold to generally rally higher now, hit the ZERO level and get turned back – possibly to new lows. For now, however, I see no reason why gold has not indeed bottomed and is ready to rally higher. I will reassess the ZERO crossover issue when we get there.
If you enjoy technical analysis, maybe are curious to learn more about the True Strength Index indicator and how to use it, or just like to be a part of discussion about market and gold price direction, I invite you to visit my website. www.theTSItrader.blogspot.com I provide some useful data on 15 mining stocks with explosive projected earnings, a study of the gold secular bull market beginning in 2001 with charts, and heck, I even post my trading record. Or, you can drop me a line at: tsiTrader@gmail.com
Good trading to you,
John Townsend
mailto:TSItrader@gmail.com
© 2010 Copyright John Townsend - All Rights Reserved
Disclaimer: The above is a matter of opinion provided for general information purposes only and is not intended as investment advice. Information and analysis above are derived from sources and utilising methods believed to be reliable, but we cannot accept responsibility for any losses you may incur as a result of this analysis. Individuals should consult with their personal financial advisors.
© 2005-2022 http://www.MarketOracle.co.uk - The Market Oracle is a FREE Daily Financial Markets Analysis & Forecasting online publication.